Put labels on a map.
labelLayer(
  x,
  spdf,
  df,
  spdfid = NULL,
  dfid = NULL,
  txt,
  col = "black",
  cex = 0.7,
  overlap = TRUE,
  show.lines = TRUE,
  halo = FALSE,
  bg = "white",
  r = 0.1,
  ...
)
Arguments
- x
an sf object, a simple feature collection. spdf, df, dfid and spdfid are not used.
- spdf
a SpatialPointsDataFrame or a SpatialPolygonsDataFrame; if spdf is a SpatialPolygonsDataFrame texts are plotted on centroids.
- df
a data frame that contains the labels to plot. If df is missing spdf@data is used instead.
- spdfid
name of the identifier variable in spdf, default to the first column of the spdf data frame. (optional)
- dfid
name of the identifier variable in df, default to the first column of df. (optional)
- txt
labels variable.
- col
labels color.
- cex
labels cex.
- overlap
if FALSE, labels are moved so they do not overlap.
- show.lines
if TRUE, then lines are plotted between x,y and the word, for those words not covering their x,y coordinate
- halo
If TRUE, then a 'halo' is printed around the text and additional arguments bg and r can be modified to set the color and width of the halo.
- bg
halo color if halo is TRUE
- r
width of the halo
- ...
further text arguments.
See also
Examples
library(sf)
opar <- par(mar = c(0,0,0,0))
mtq <- st_read(system.file("gpkg/mtq.gpkg", package="cartography"))
#> Reading layer `mtq' from data source
#> `/tmp/RtmpmpfIrO/temp_libpath18ee15f22a9e/cartography/gpkg/mtq.gpkg'
#> using driver `GPKG'
#> Simple feature collection with 34 features and 7 fields
#> Geometry type: MULTIPOLYGON
#> Dimension: XY
#> Bounding box: xmin: 690574 ymin: 1592536 xmax: 735940.2 ymax: 1645660
#> Projected CRS: WGS 84 / UTM zone 20N
plot(st_geometry(mtq), col = "darkseagreen3", border = "darkseagreen4",
bg = "#A6CAE0")
labelLayer(x = mtq, txt = "LIBGEO", col= "black", cex = 0.7, font = 4,
halo = TRUE, bg = "white", r = 0.1,
overlap = FALSE, show.lines = FALSE)
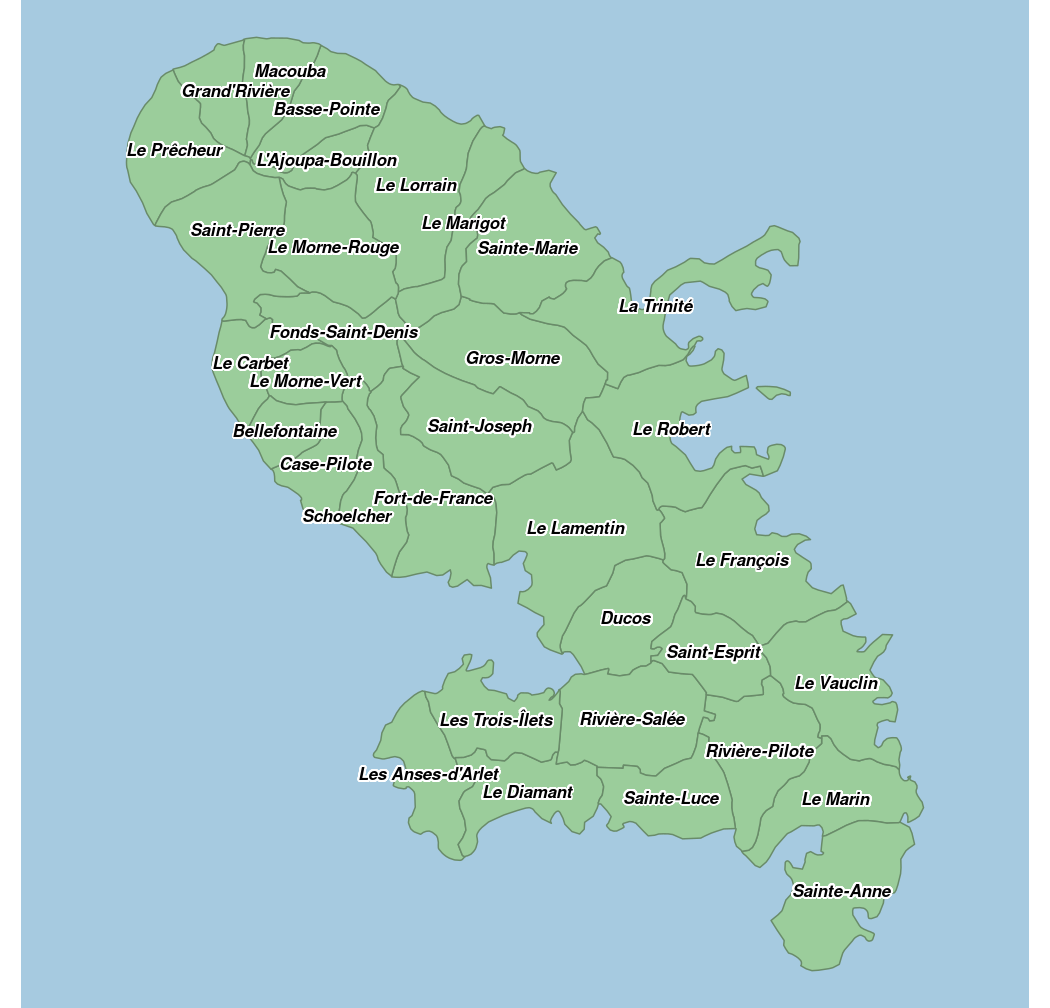 par(opar)