Plot legend for proportional lines maps
legendPropLines(
  pos = "topleft",
  title.txt = "Title of the legend",
  title.cex = 0.8,
  cex = 1,
  values.cex = 0.6,
  var,
  lwd,
  col = "red",
  frame = FALSE,
  values.rnd = 0
)
Arguments
- pos
position of the legend, one of "topleft", "top", "topright", "right", "bottomright", "bottom", "bottomleft", "bottomleftextra", "left" or a vector of two coordinates in map units (c(x, y)).
- title.txt
title of the legend.
- title.cex
size of the legend title.
- cex
size of the legend. 2 means two times bigger.
- values.cex
size of the values in the legend.
- var
vector of values (at least min and max).
- lwd
width of the larger line.
- col
color of symbols.
- frame
whether to add a frame to the legend (TRUE) or not (FALSE).
- values.rnd
number of decimal places of the values in the legend.
Examples
library(sf)
mtq <- st_read(system.file("gpkg/mtq.gpkg", package="cartography"))
#> Reading layer `mtq' from data source
#> `/tmp/RtmpmpfIrO/temp_libpath18ee15f22a9e/cartography/gpkg/mtq.gpkg'
#> using driver `GPKG'
#> Simple feature collection with 34 features and 7 fields
#> Geometry type: MULTIPOLYGON
#> Dimension: XY
#> Bounding box: xmin: 690574 ymin: 1592536 xmax: 735940.2 ymax: 1645660
#> Projected CRS: WGS 84 / UTM zone 20N
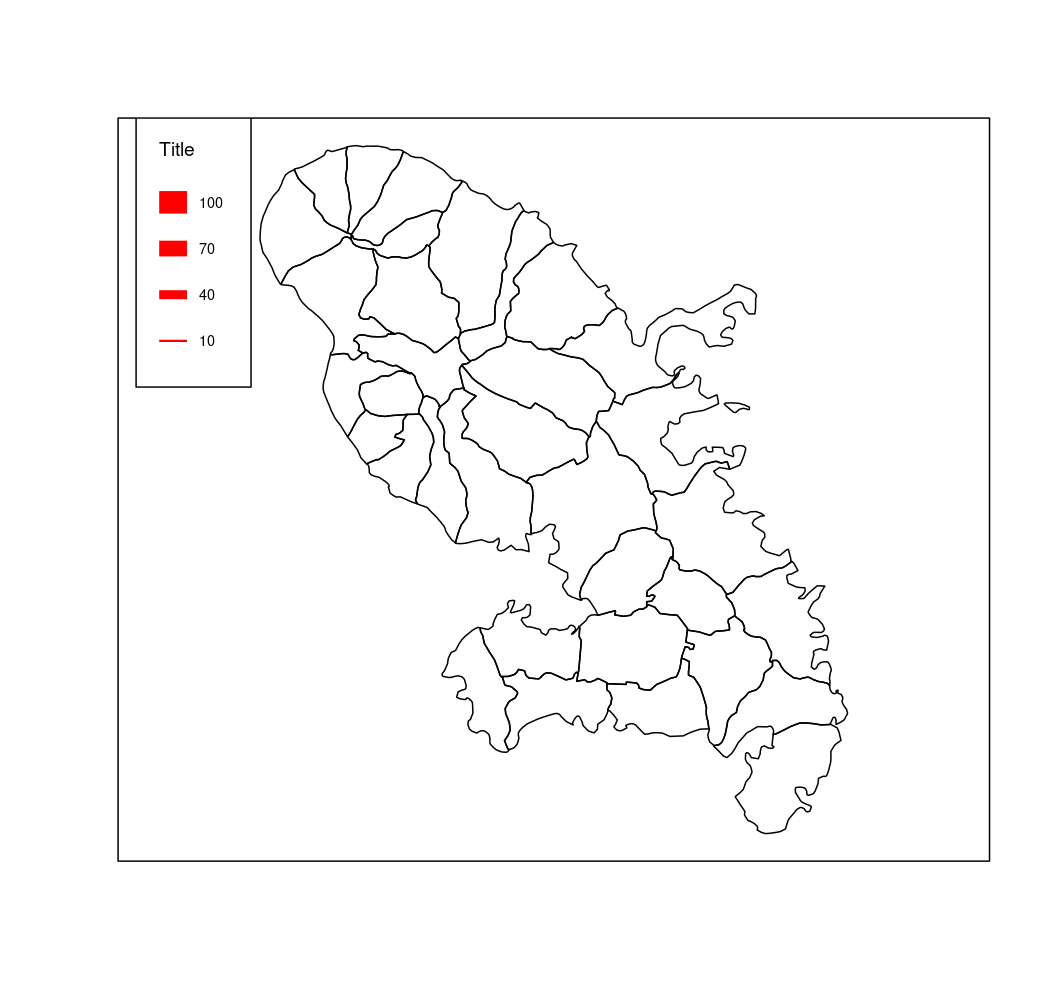
plot(st_geometry(mtq))
box()
legendPropLines(pos = "topleft", title.txt = "Title",
title.cex = 0.8, values.cex = 0.6, cex = 1,
var = c(10,100),
lwd = 15,
col="red", frame=TRUE, values.rnd=0)