Plot a proportional symbols layer.
propSymbolsLayer(
  x,
  spdf,
  df,
  spdfid = NULL,
  dfid = NULL,
  var,
  inches = 0.3,
  fixmax = NULL,
  symbols = "circle",
  col = "#E84923",
  border = "black",
  lwd = 1,
  legend.pos = "bottomleft",
  legend.title.txt = var,
  legend.title.cex = 0.8,
  legend.values.cex = 0.6,
  legend.values.rnd = 0,
  legend.style = "c",
  legend.frame = FALSE,
  add = TRUE
)
Arguments
- x
an sf object, a simple feature collection. If x is used then spdf, df, spdfid and dfid are not.
- spdf
a SpatialPointsDataFrame or a SpatialPolygonsDataFrame; if spdf is a SpatialPolygonsDataFrame symbols are plotted on centroids.
- df
a data frame that contains the values to plot. If df is missing spdf@data is used instead.
- spdfid
identifier field in spdf, default to the first column of the spdf data frame. (optional)
- dfid
identifier field in df, default to the first column of df. (optional)
- var
name of the numeric field in df to plot.
- inches
size of the biggest symbol (radius for circles, width for squares, height for bars) in inches.
- fixmax
value of the biggest symbol (see Details).
- symbols
type of symbols, one of "circle", "square" or "bar".
- col
color of symbols.
- border
color of symbols borders.
- lwd
width of symbols borders.
- legend.pos
position of the legend, one of "topleft", "top", "topright", "right", "bottomright", "bottom", "bottomleft", "left" or a vector of two coordinates in map units (c(x, y)). If legend.pos is "n" then the legend is not plotted.
- legend.title.txt
title of the legend.
- legend.title.cex
size of the legend title.
- legend.values.cex
size of the values in the legend.
- legend.values.rnd
number of decimal places of the values displayed in the legend.
- legend.style
either "c" or "e". The legend has two display styles, "c" stands for compact and "e" for extended.
- legend.frame
boolean; whether to add a frame to the legend (TRUE) or not (FALSE).
- add
whether to add the layer to an existing plot (TRUE) or not (FALSE).
Details
Two maps with the same inches and fixmax parameters will be comparable.
See also
Examples
library(sf)
mtq <- st_read(system.file("gpkg/mtq.gpkg", package="cartography"))
#> Reading layer `mtq' from data source
#>   `/tmp/RtmpmpfIrO/temp_libpath18ee15f22a9e/cartography/gpkg/mtq.gpkg'
#>   using driver `GPKG'
#> Simple feature collection with 34 features and 7 fields
#> Geometry type: MULTIPOLYGON
#> Dimension:     XY
#> Bounding box:  xmin: 690574 ymin: 1592536 xmax: 735940.2 ymax: 1645660
#> Projected CRS: WGS 84 / UTM zone 20N
plot(st_geometry(mtq))
propSymbolsLayer(x = mtq, var = "POP")


plot(st_geometry(mtq), col = "lightblue4",border = "lightblue3",
     bg = "lightblue1")
# Population plot on proportional symbols
propSymbolsLayer(x = mtq, var = "POP",
                 symbols = "circle", col =  "white",
                 legend.pos = "right", border = "grey",
                 legend.title.txt = "Total\nPopulation",
                 legend.style = "c")
# Layout plot
layoutLayer(title = "Population Distribution in Martinique, 2015")
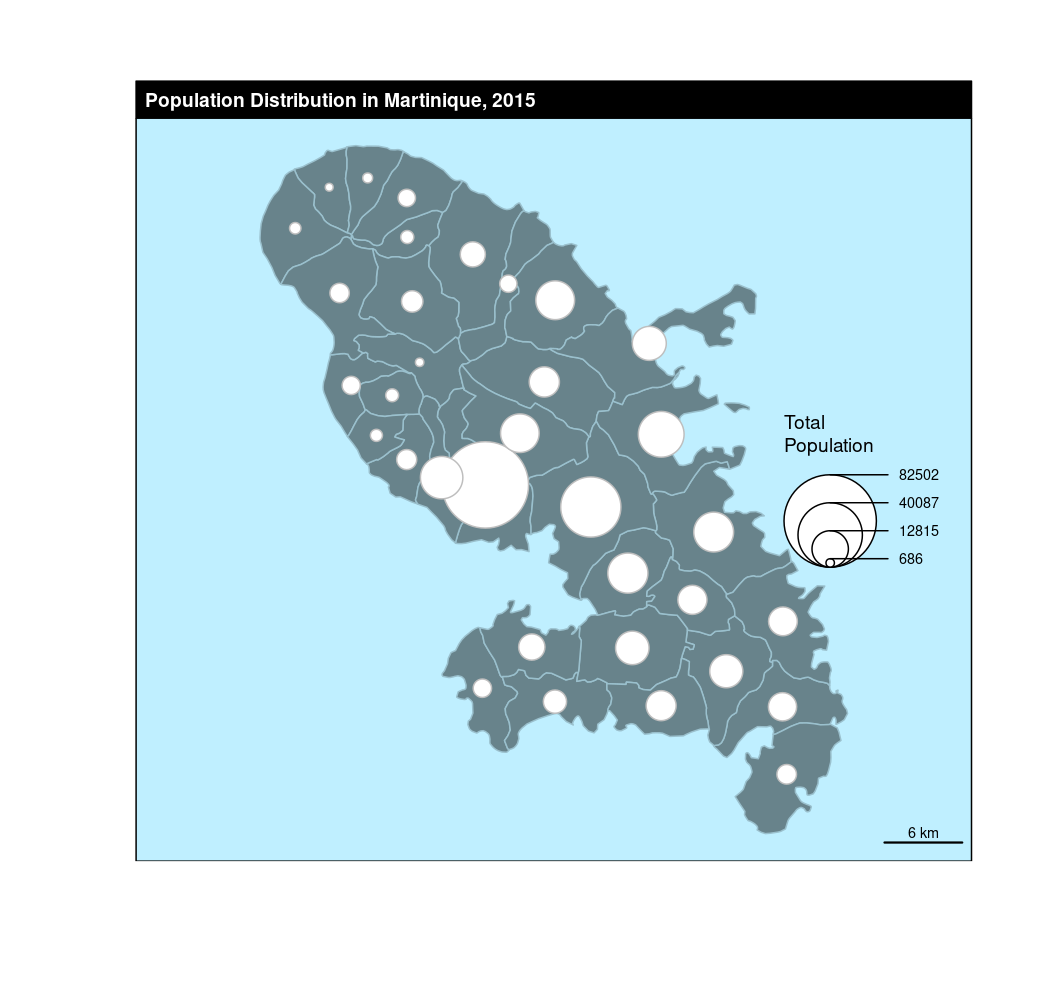
plot(st_geometry(mtq), col = "lightblue4",border = "lightblue3",
bg = "lightblue1")
# Population plot on proportional symbols
propSymbolsLayer(x = mtq, var = "POP",
symbols = "circle", col = "white",
legend.pos = "right", border = "grey",
legend.title.txt = "Total\nPopulation",
legend.style = "c")
# Layout plot
layoutLayer(title = "Population Distribution in Martinique, 2015")