Plot a double proportional triangles layer.
propTrianglesLayer(
  x,
  spdf,
  df,
  spdfid = NULL,
  dfid = NULL,
  var1,
  col1 = "#E84923",
  var2,
  col2 = "#7DC437",
  k = 0.02,
  legend.pos = "topright",
  legend.title.txt = paste(var1, var2, sep = " / "),
  legend.title.cex = 0.8,
  legend.var1.txt = var1,
  legend.var2.txt = var2,
  legend.values.cex = 0.6,
  legend.values.rnd = 0,
  legend.style = "c",
  legend.frame = FALSE,
  add = TRUE
)
Arguments
- x
an sf object, a simple feature collection. If x is used then spdf, df, spdfid and dfid are not.
- spdf
a SpatialPointsDataFrame or a SpatialPolygonsDataFrame; if spdf is a SpatialPolygonsDataFrame symbols are plotted on centroids.
- df
a data frame that contains the values to plot. If df is missing spdf@data is used instead.
- spdfid
name of the identifier variable in spdf, default to the first column of the spdf data frame. (optional)
- dfid
name of the identifier variable in df, default to the first column of df. (optional)
- var1
name of the first numeric variable to plot, positive values only (top triangle).
- col1
color of top triangles.
- var2
name of the second numeric variable to plot, positive values only (bottom triangle).
- col2
color of bottom triangles.
- k
share of the map occupied by the biggest symbol.
- legend.pos
position of the legend, one of "topleft", "top", "topright", "left", "right", "bottomleft", "bottom", "bottomright". If legend.pos is "n" then the legend is not plotted.
- legend.title.txt
title of the legend.
- legend.title.cex
size of the legend title.
- legend.var1.txt
label of the top variable.
- legend.var2.txt
label of the bottom variable.
- legend.values.cex
size of the values in the legend.
- legend.values.rnd
number of decimal places of the values displayed in the legend.
- legend.style
either "c" or "e". The legend has two display styles, "c" stands for compact and "e" for extended.
- legend.frame
boolean; whether to add a frame to the legend (TRUE) or not (FALSE).
- add
whether to add the layer to an existing plot (TRUE) or not (FALSE).
See also
Examples
library(sf)
mtq <- st_read(system.file("gpkg/mtq.gpkg", package="cartography"))
#> Reading layer `mtq' from data source
#> `/tmp/RtmpmpfIrO/temp_libpath18ee15f22a9e/cartography/gpkg/mtq.gpkg'
#> using driver `GPKG'
#> Simple feature collection with 34 features and 7 fields
#> Geometry type: MULTIPOLYGON
#> Dimension: XY
#> Bounding box: xmin: 690574 ymin: 1592536 xmax: 735940.2 ymax: 1645660
#> Projected CRS: WGS 84 / UTM zone 20N
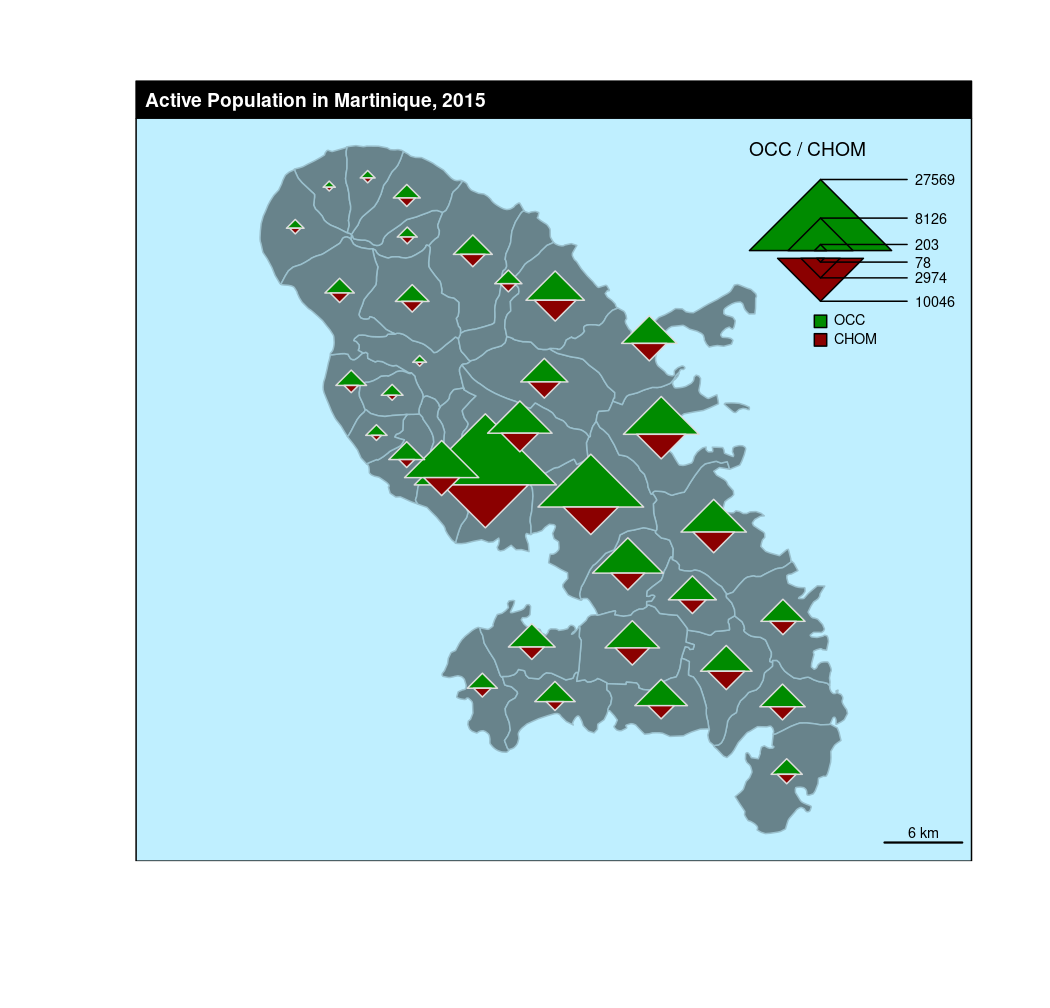
# Employed Active Population
mtq$OCC <- mtq$ACT-mtq$CHOM
plot(st_geometry(mtq), col = "lightblue4",border = "lightblue3",
bg = "lightblue1")
propTrianglesLayer(x = mtq, var1 = "OCC", var2 = "CHOM",
col1="green4",col2="red4",k = 0.1)
layoutLayer(title = "Active Population in Martinique, 2015")