Plot a typology layer.
typoLayer(
  x,
  spdf,
  df,
  spdfid = NULL,
  dfid = NULL,
  var,
  col = NULL,
  border = "grey20",
  lwd = 1,
  colNA = "white",
  legend.pos = "bottomleft",
  legend.title.txt = var,
  legend.title.cex = 0.8,
  legend.values.cex = 0.6,
  legend.values.order = NULL,
  legend.nodata = "no data",
  legend.frame = FALSE,
  add = FALSE
)
Arguments
- x
an sf object, a simple feature collection. If x is used then spdf, df, spdfid and dfid are not.
- spdf
a SpatialPolygonsDataFrame.
- df
a data frame that contains the values to plot. If df is missing spdf@data is used instead.
- spdfid
name of the identifier variable in spdf, default to the first column of the spdf data frame. (optional)
- dfid
name of the identifier variable in df, default to the first column of df. (optional)
- var
name of the variable to plot.
- col
a vector of colors.
- border
color of the polygons borders.
- lwd
borders width.
- colNA
no data color.
- legend.pos
position of the legend, one of "topleft", "top", "topright", "right", "bottomright", "bottom", "bottomleft", "left" or a vector of two coordinates in map units (c(x, y)). If legend.pos is "n" then the legend is not plotted.
- legend.title.txt
title of the legend.
- legend.title.cex
size of the legend title.
- legend.values.cex
size of the values in the legend.
- legend.values.order
values order in the legend, a character vector that matches var modalities. Colors will be affected following this order.
- legend.nodata
no data label.
- legend.frame
whether to add a frame to the legend (TRUE) or not (FALSE).
- add
whether to add the layer to an existing plot (TRUE) or not (FALSE).
See also
propSymbolsTypoLayer, typoLayer, legendTypo
Examples
library(sf)
mtq <- st_read(system.file("gpkg/mtq.gpkg", package="cartography"))
#> Reading layer `mtq' from data source
#> `/tmp/RtmpmpfIrO/temp_libpath18ee15f22a9e/cartography/gpkg/mtq.gpkg'
#> using driver `GPKG'
#> Simple feature collection with 34 features and 7 fields
#> Geometry type: MULTIPOLYGON
#> Dimension: XY
#> Bounding box: xmin: 690574 ymin: 1592536 xmax: 735940.2 ymax: 1645660
#> Projected CRS: WGS 84 / UTM zone 20N
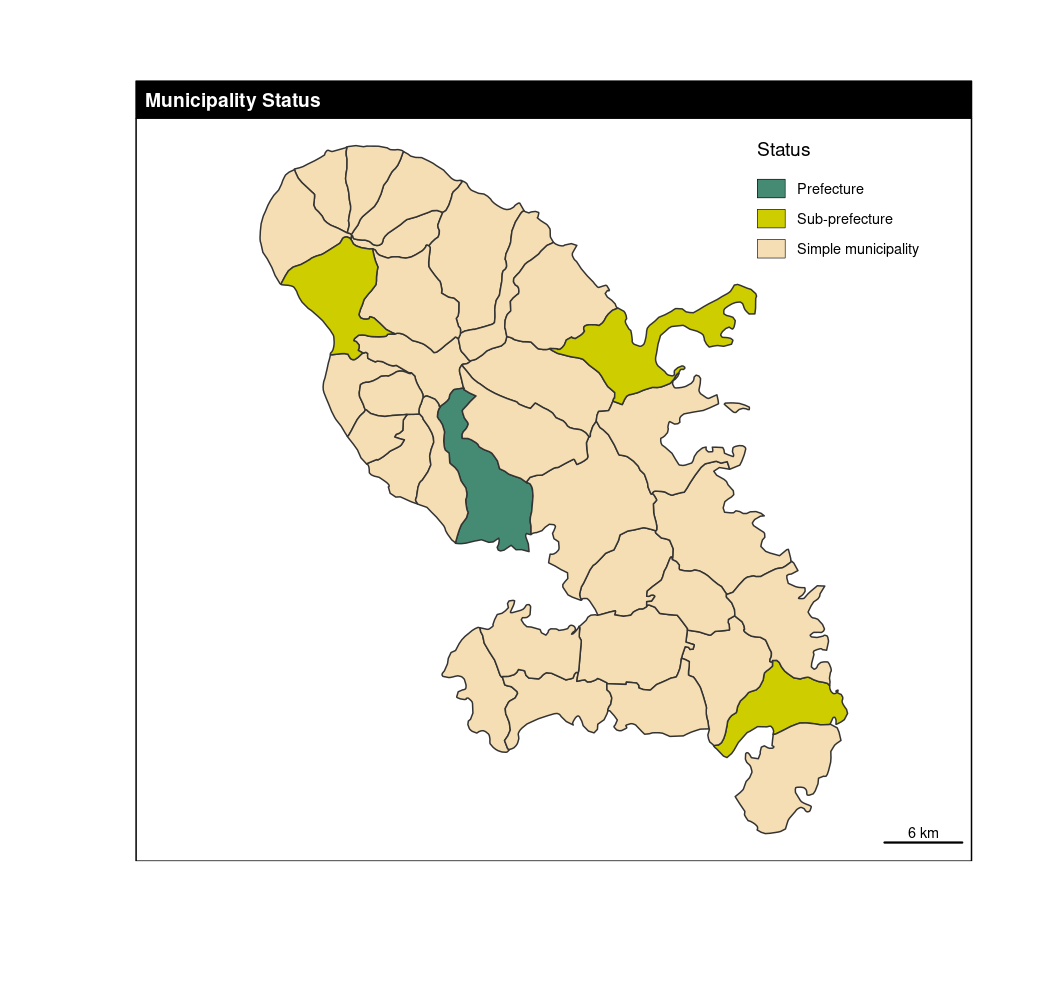
typoLayer(x = mtq, var="STATUS",
col = c("aquamarine4", "yellow3","wheat"),
legend.values.order = c("Prefecture",
"Sub-prefecture",
"Simple municipality"),
legend.pos = "topright",
legend.title.txt = "Status")
layoutLayer(title = "Municipality Status")