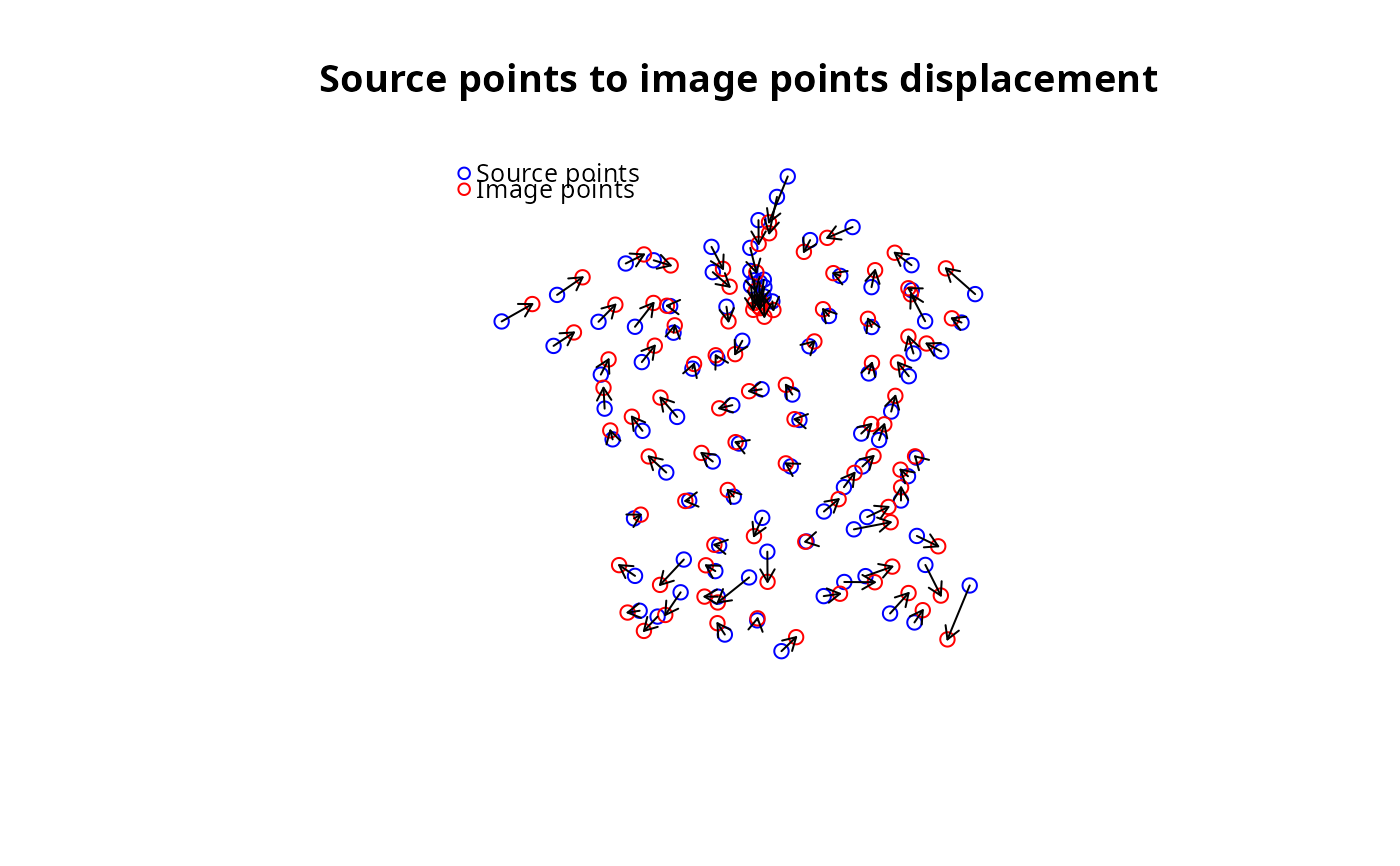
Plot the result of dc_adjust
Usage
# S3 method for class 'adjustment_result'
plot(x, ...)
Arguments
- x
object of class adjustment_result
- ...
further specifications, see plot for details
Examples
library(sf)

# Read source points
source_pts <- st_read(
  dsn = system.file("gpkg/data-prefecture.gpkg", package = "distanamo"),
  layer = "prefecture", quiet = TRUE
)

# Read non adjusted image points
image_pts_not_adj <- st_read(
  dsn = system.file("gpkg/data-prefecture.gpkg", package = "distanamo"),
  layer = "image-points-not-adjusted", quiet = TRUE
)

# Read the background layer to deform
background_layer <- st_read(
  dsn = system.file("gpkg/data-prefecture.gpkg", package = "distanamo"),
  layer = "departement", quiet = TRUE
)

# Adjust image points to source points
adj_result <- dc_adjust(
  source_points = source_pts,
  image_points = image_pts_not_adj,
  "euclidean"
)

# Plot result of the adjustment step
plot(adj_result)


# Summary statistics of the adjustment step
summary(adj_result)
#> Summary of the adjustment:
#> Min displacement: 2349.236 [m]
#> Mean displacement: 34569.15 [m]
#> Max displacement: 108405.5 [m]
#> Transformation matrix:
#>      358.1063 1126.673 673162.7
#>      -1170.315 396.8617 6619705
#> Scale: 1208.994
#> RMSE: 39842.59
#> RMSE x: 25310.6
#> RMSE y: 30770.21
# Summary statistics of the adjustment step
summary(adj_result)
#> Summary of the adjustment:
#> Min displacement: 2349.236 [m]
#> Mean displacement: 34569.15 [m]
#> Max displacement: 108405.5 [m]
#> Transformation matrix:
#> 358.1063 1126.673 673162.7
#> -1170.315 396.8617 6619705
#> Scale: 1208.994
#> RMSE: 39842.59
#> RMSE x: 25310.6
#> RMSE y: 30770.21