Plot the interpolation grid, resulting from dc_create
Usage
# S3 method for class 'interpolation_grid'
plot(
x,
which = 1:4,
ask = interactive(),
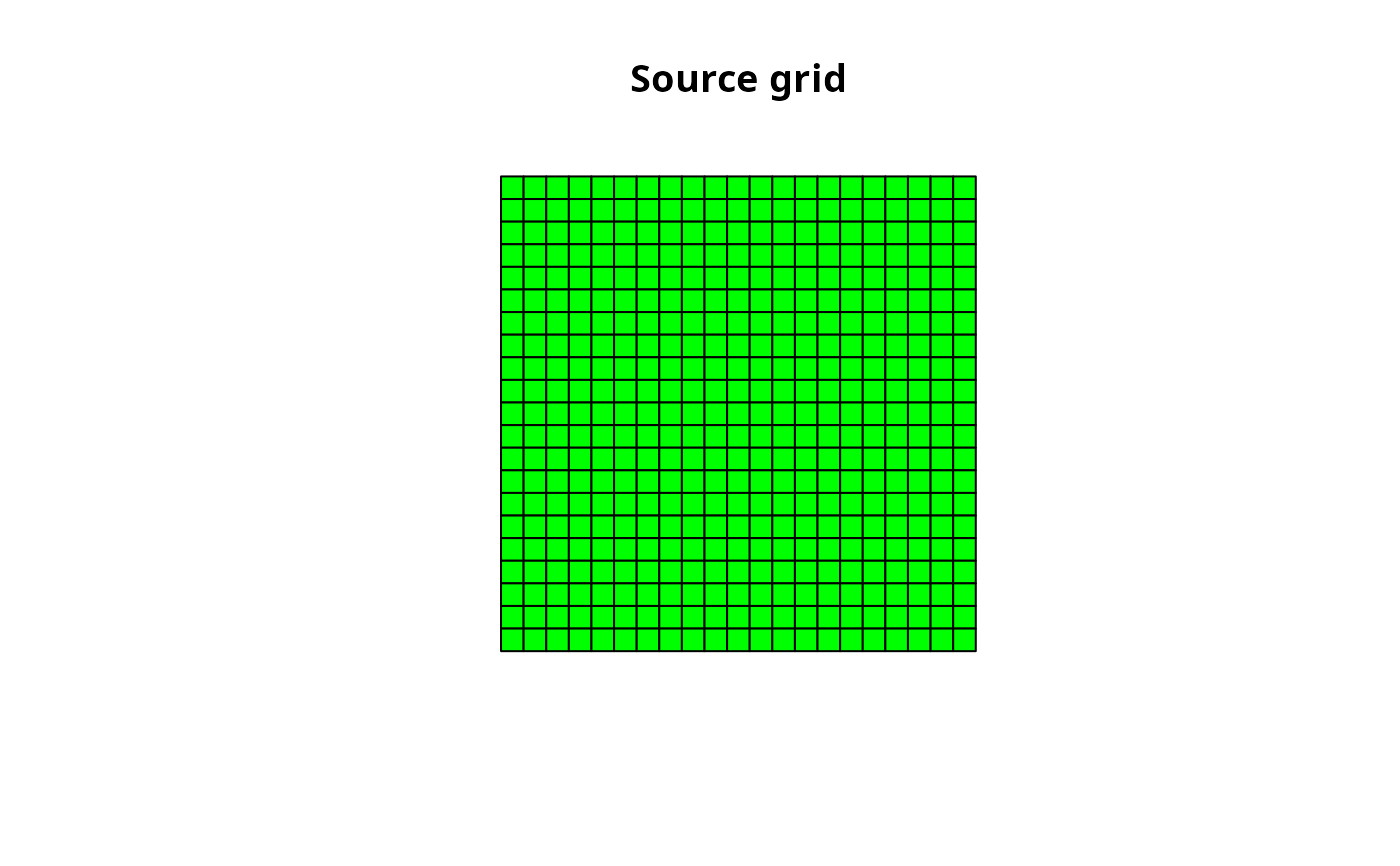
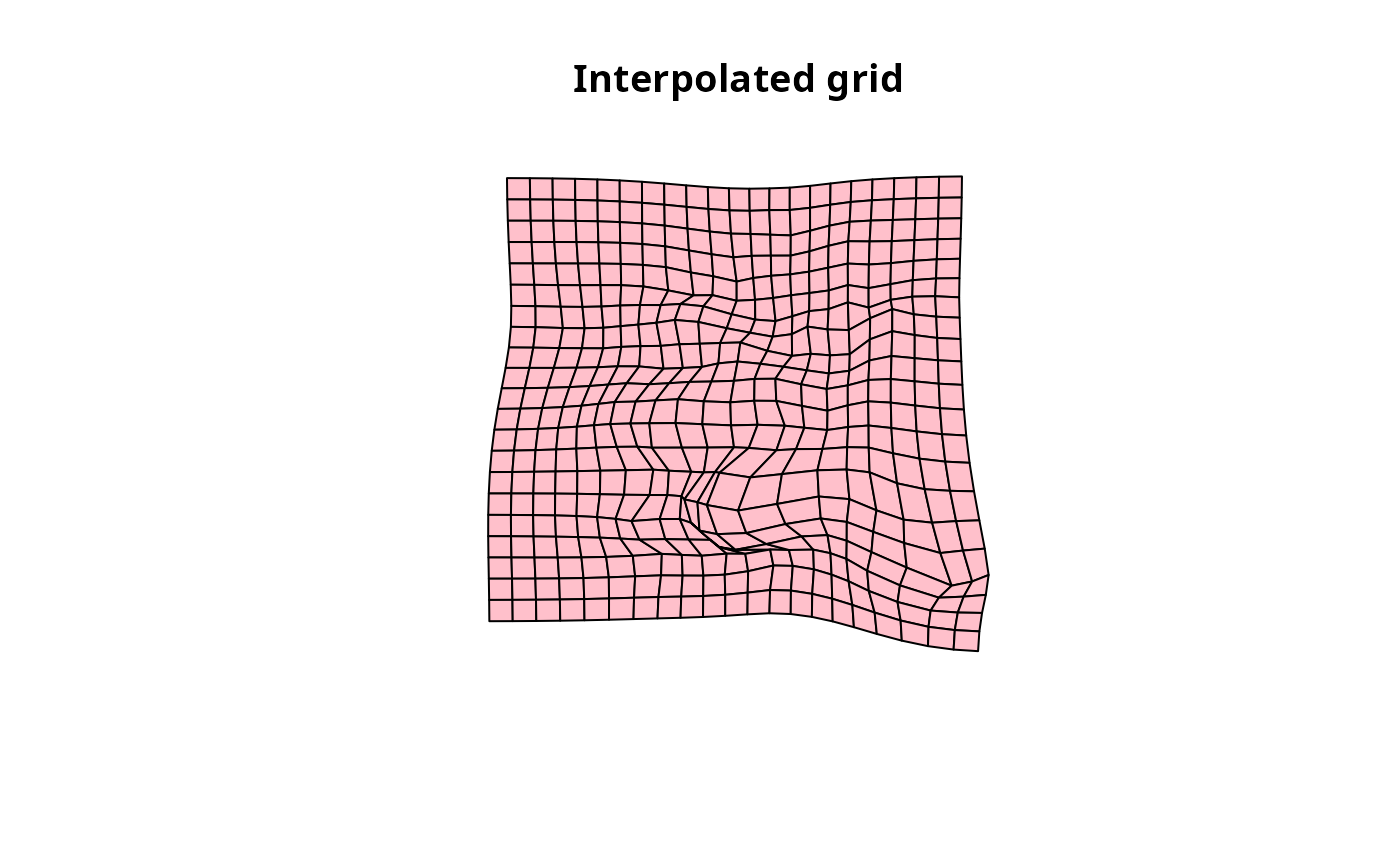
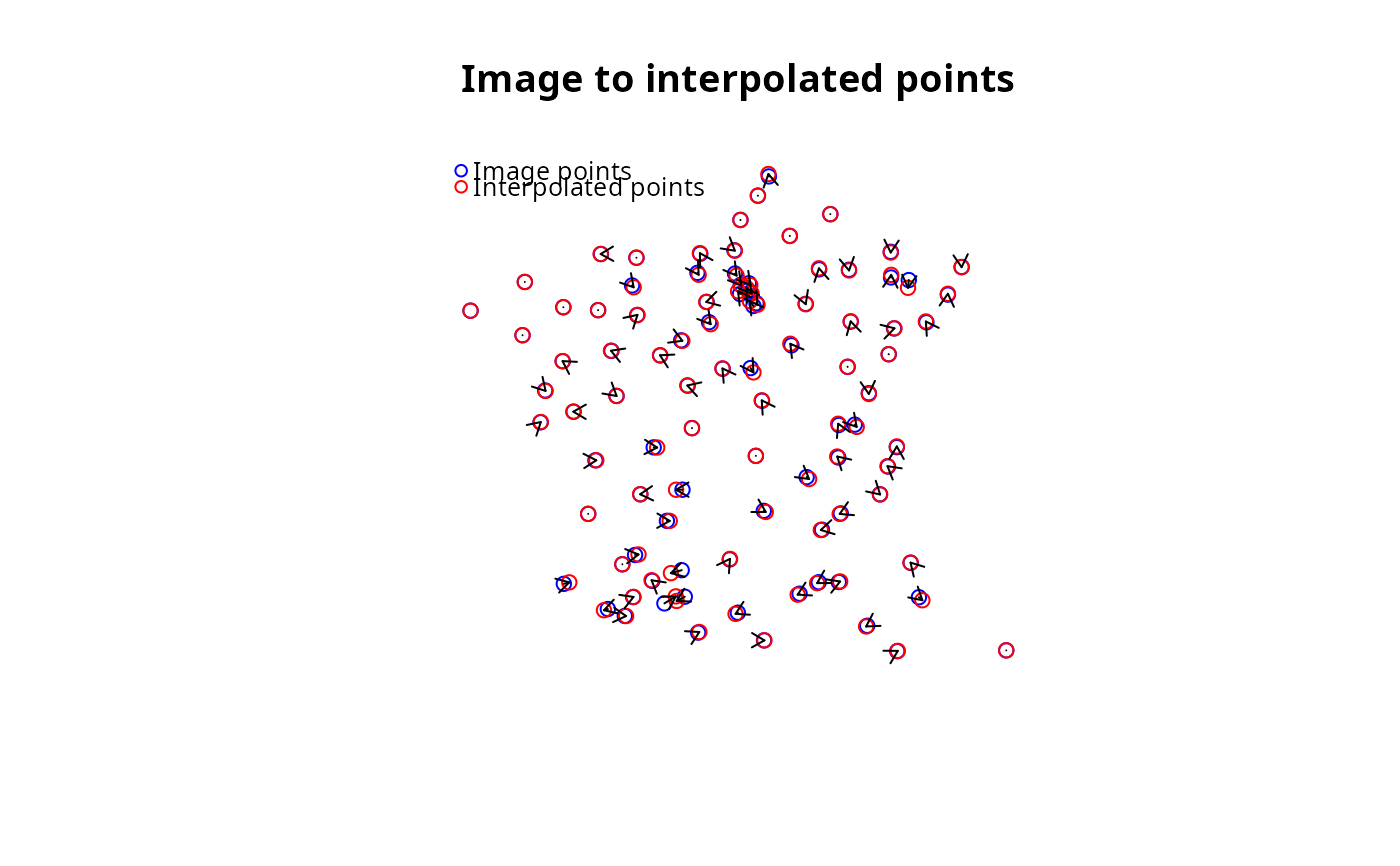
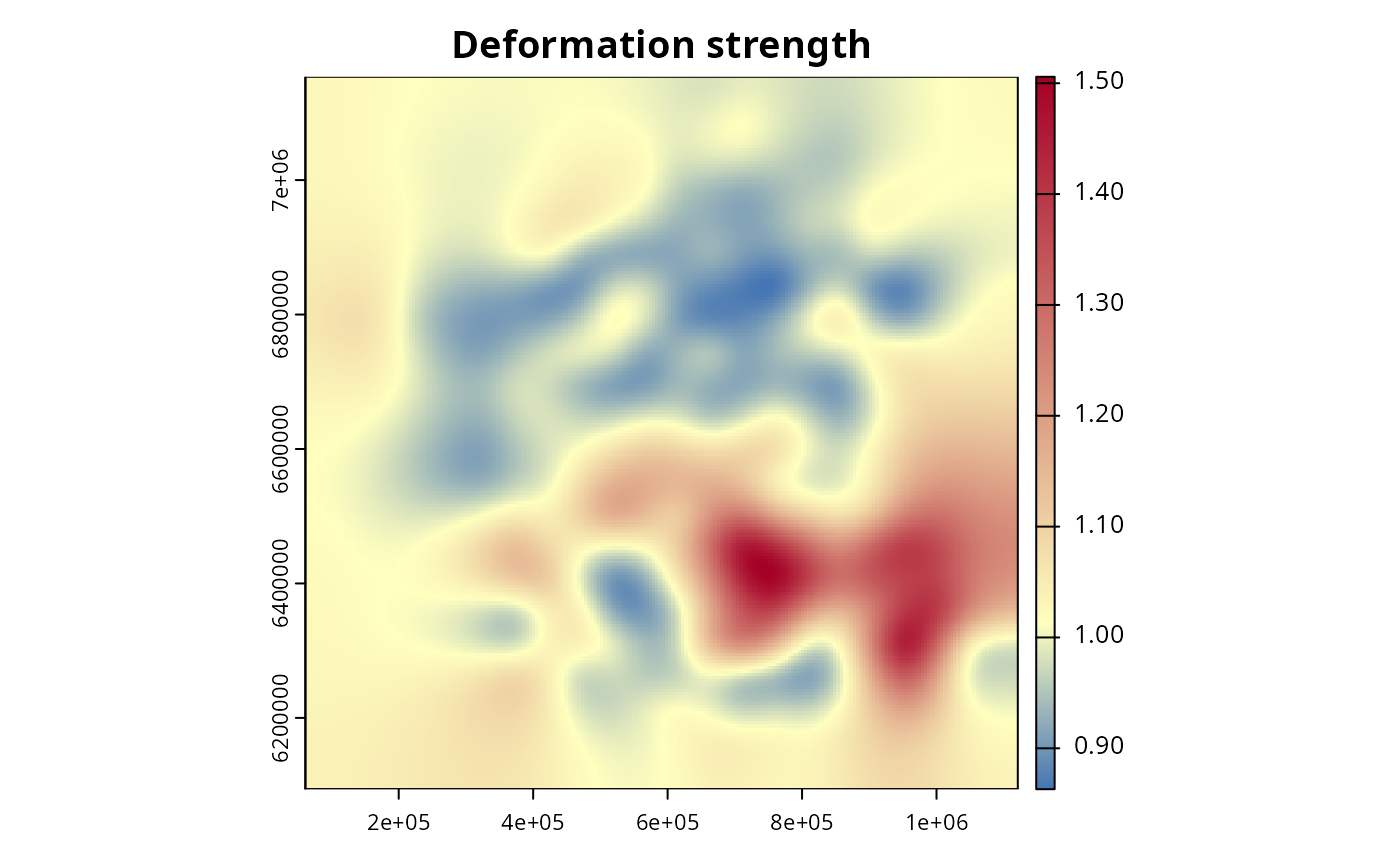
caption = list("Source grid", "Interpolated grid", "Image to interpolated points",
"Deformation strength"),
...
)Arguments
- x
object of class interpolation_grid
- which
which plot to display, a subset of 1:4 (the default)
- ask
logical; if TRUE, the user is asked before each plot
- caption
captions to appear above the plots; character vector or list of valid graphics annotations
- ...
further specifications, see plot for details
Examples
library(sf)

# Read source points
source_pts <- st_read(
  dsn = system.file("gpkg/data-prefecture.gpkg", package = "distanamo"),
  layer = "prefecture", quiet = TRUE
)

# Read image points
image_pts <- st_read(
  dsn = system.file("gpkg/data-prefecture.gpkg", package = "distanamo"),
  layer = "image-points", quiet = TRUE
)

# Read the background layer to deform
background_layer <- st_read(
  dsn = system.file("gpkg/data-prefecture.gpkg", package = "distanamo"),
  layer = "departement", quiet = TRUE
)

# Create the interpolation grid
igrid <- dc_create(
  source_points = source_pts,
  image_points = image_pts,
  precision = 2,
  bbox = st_bbox(background_layer)
)

# Plot various depictions of the interpolation grid
plot(igrid)


# Useful information about the interpolation grid
summary(igrid)
#> Summary of the interpolation grid:
#> Number of cells: 441
#> Precision: 50462.76 (α = 2)
#> Deformation strength: 1.041534
#> Mean absolute error: 3734.717
#> RMSE (interp - image): 4989.972
#> RMSE x (interp - image): 4060.84
#> RMSE y (interp - image): 2899.896
#> RMSE (interp - source): 42725.87
#> RMSE x (interp - source): 32080.25
#> RMSE y (interp - source): 28219.8
#> R squared: 0.9997285