summary interpolation_grid object
Source:R/summary.interpolation_grid.R
summary.interpolation_grid.RdCompute summary statistics for interpolation_grid
Usage
# S3 method for class 'interpolation_grid'
summary(object, ...)
Arguments
- object
object of class interpolation_grid
- ...
further specifications, see summary for details
Examples
library(sf)
# Read source points
source_pts <- st_read(
dsn = system.file("gpkg/data-prefecture.gpkg", package = "distanamo"),
layer = "prefecture", quiet = TRUE
)
# Read image points
image_pts <- st_read(
dsn = system.file("gpkg/data-prefecture.gpkg", package = "distanamo"),
layer = "image-points", quiet = TRUE
)
# Read the background layer to deform
background_layer <- st_read(
dsn = system.file("gpkg/data-prefecture.gpkg", package = "distanamo"),
layer = "departement", quiet = TRUE
)
# Create the interpolation grid
igrid <- dc_create(
source_points = source_pts,
image_points = image_pts,
precision = 2,
bbox = st_bbox(background_layer)
)
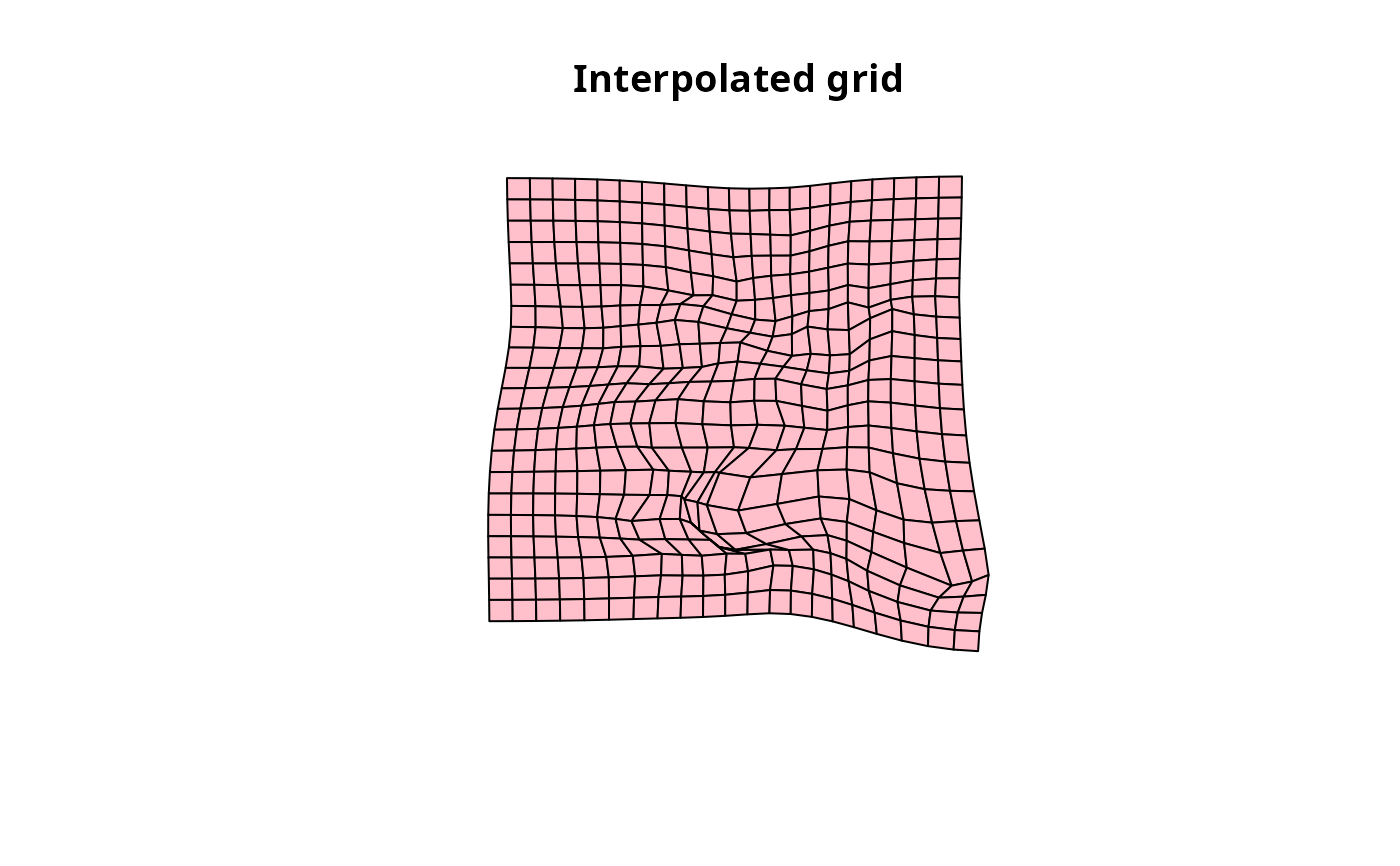
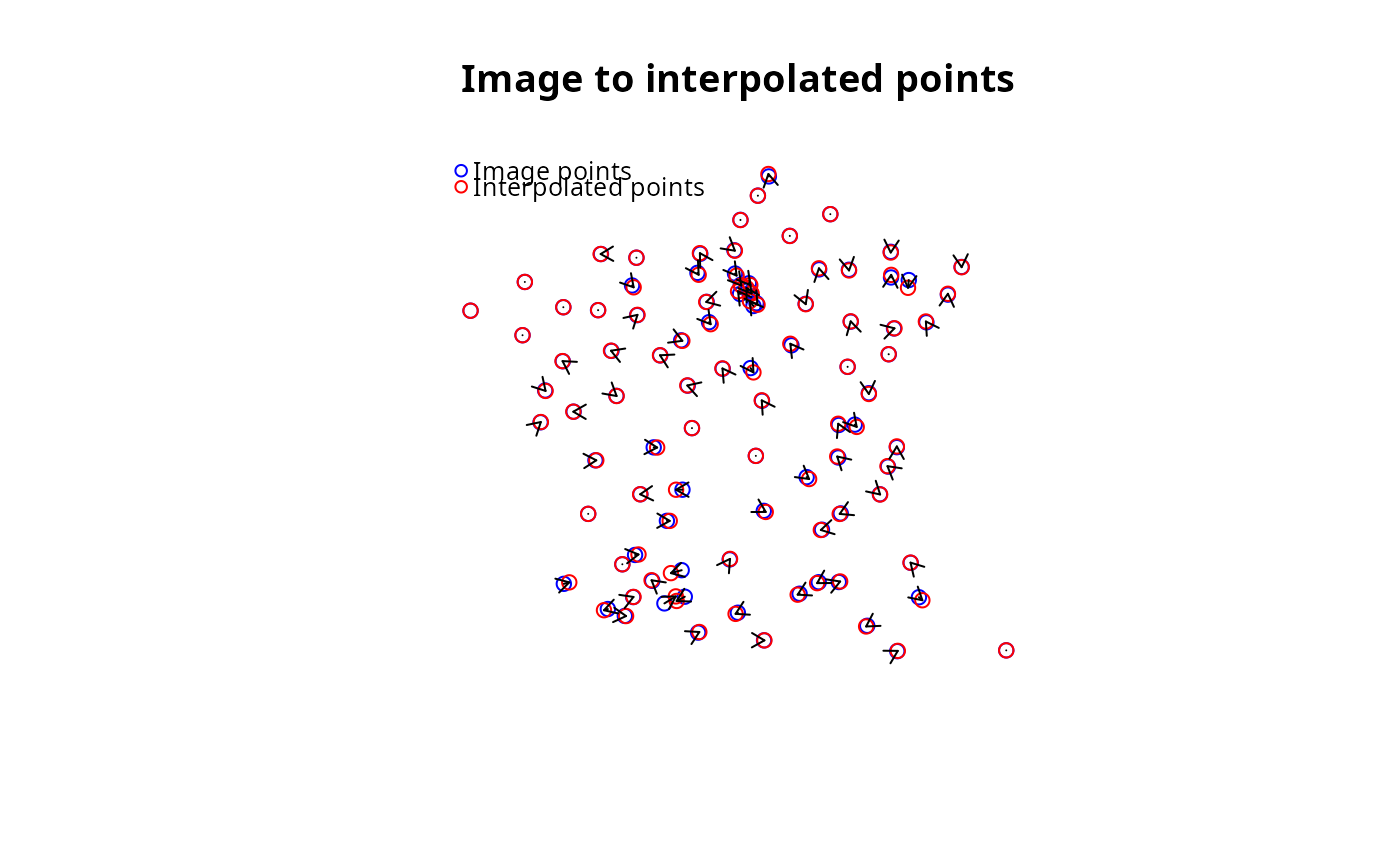
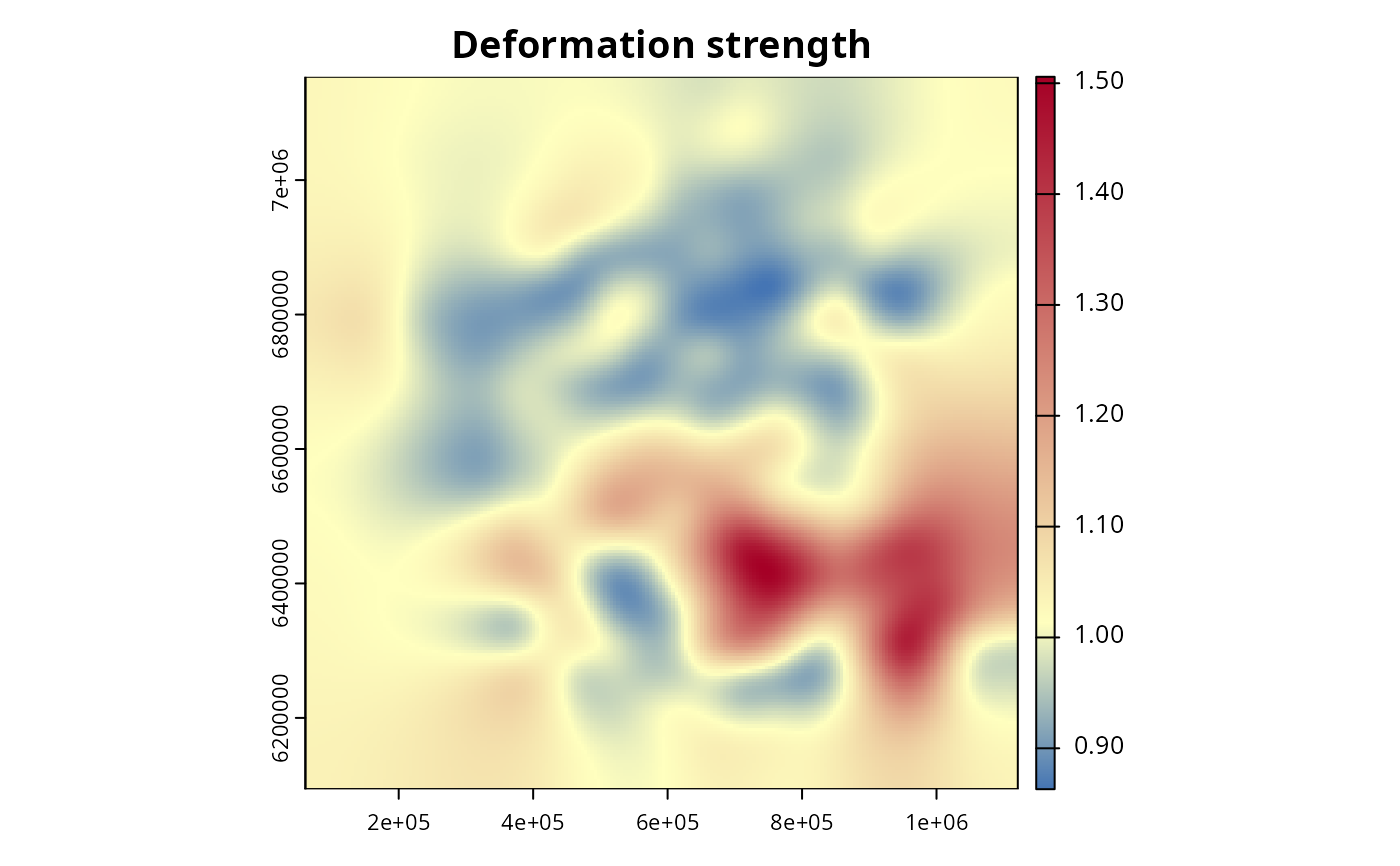
# Plot various depictions of the interpolation grid
plot(igrid)

 # Useful information about the interpolation grid
summary(igrid)
#> Summary of the interpolation grid:
#> Number of cells: 441
#> Precision: 50462.76 (α = 2)
#> Deformation strength: 1.041534
#> Mean absolute error: 3734.717
#> RMSE (interp - image): 4989.972
#> RMSE x (interp - image): 4060.84
#> RMSE y (interp - image): 2899.896
#> RMSE (interp - source): 42725.87
#> RMSE x (interp - source): 32080.25
#> RMSE y (interp - source): 28219.8
#> R squared: 0.9997285
# Useful information about the interpolation grid
summary(igrid)
#> Summary of the interpolation grid:
#> Number of cells: 441
#> Precision: 50462.76 (α = 2)
#> Deformation strength: 1.041534
#> Mean absolute error: 3734.717
#> RMSE (interp - image): 4989.972
#> RMSE x (interp - image): 4060.84
#> RMSE y (interp - image): 2899.896
#> RMSE (interp - source): 42725.87
#> RMSE x (interp - source): 32080.25
#> RMSE y (interp - source): 28219.8
#> R squared: 0.9997285