
Map projections
This package provides access to a wide range of map projections. It allows spatial data frames containing geographic coordinates (latitude/longitude) to be projected. Projection calculations are performed using spherical geometry rather than ellipsoidal geodetic models.
Installation
You can install the released version of planisphere from CRAN with:
install.packages("planisphere")Alternatively, you can install the development version of planisphere from r-universe with:
install.packages("planisphere", repos = c("https://riatelab.r-universe.dev", "https://cloud.r-project.org"))Usage
The package provides two main functions.
-
project()applies a map projection to a spatial dataframe. -
display()plot the projected spatial dataframe.
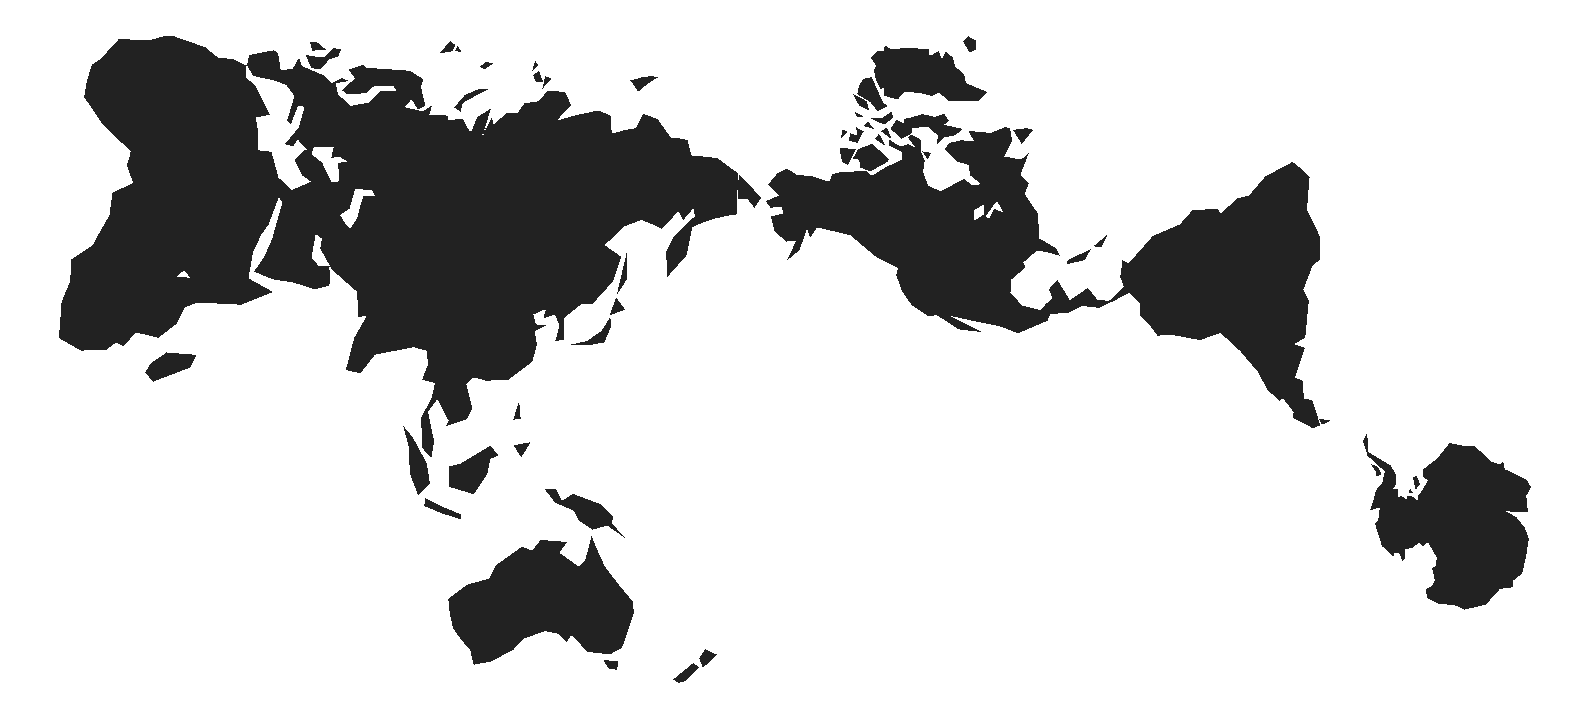
library(sf)

world <- st_read(
  system.file("gpkg/land.gpkg", package = "planisphere"),
  quiet = TRUE
)
With additional_layers = TRUE, you can retrieve, along with the projected basemap, a list containing the basemap as well as the sphere and graticule layers. As previoulsy, you can visualize them directly using the display() function.
mollweide <- planisphere::project(x = world,
                                  proj = "InterruptedMollweide",
                                  additional_layers = TRUE
                                  )
planisphere::display(mollweide)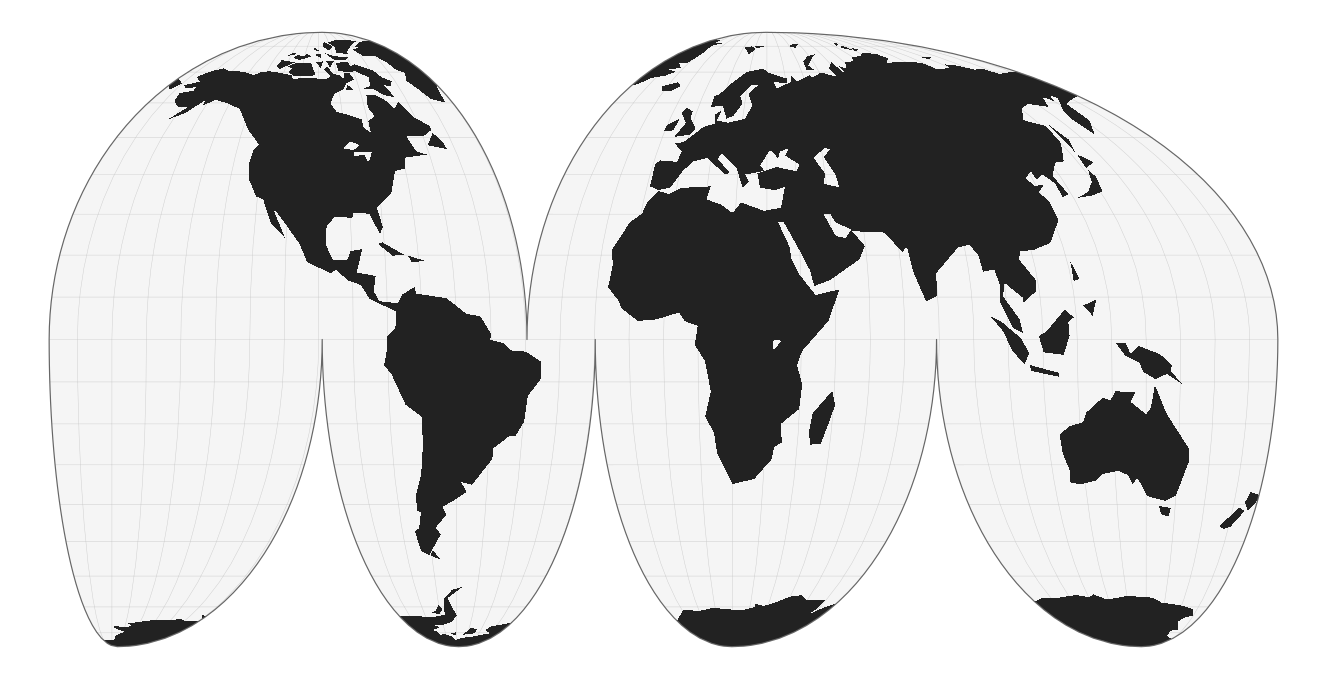
You can customize projections using dedicated parameters. For example, to obtain a polar projection:
polar <- planisphere::project(x = world,
                                  proj = "AzimuthalEquidistant",
                                  clipAngle = 150,
                                  rotate = c(0, -90),
                                  additional_layers = TRUE
                                  )
planisphere::display(polar)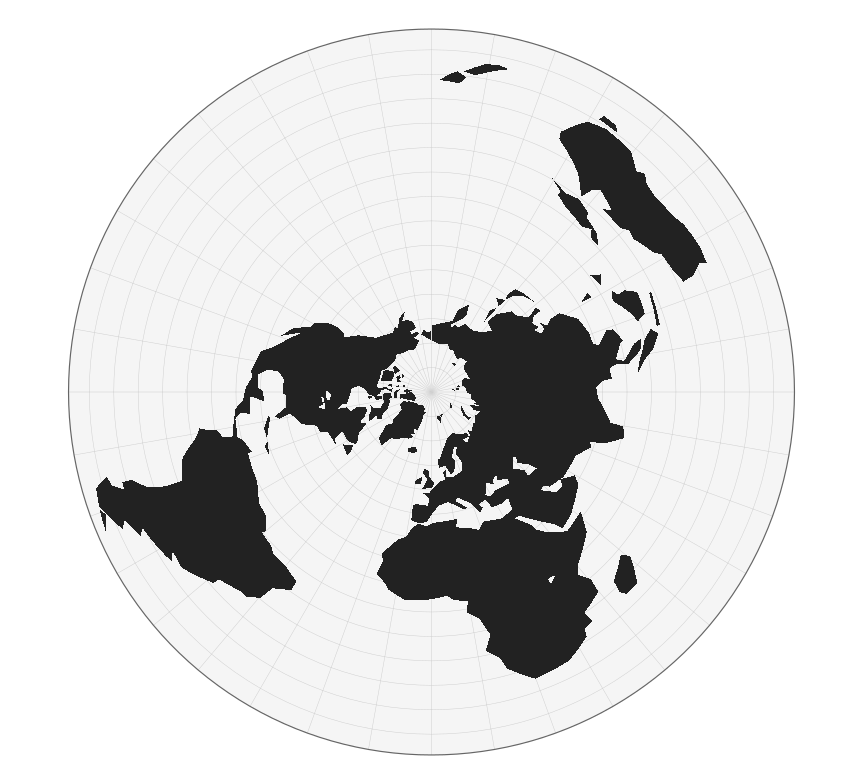
117 Projections available
The package provides more than a hundred map projections. To retrieve their names, you can use the registry() function.
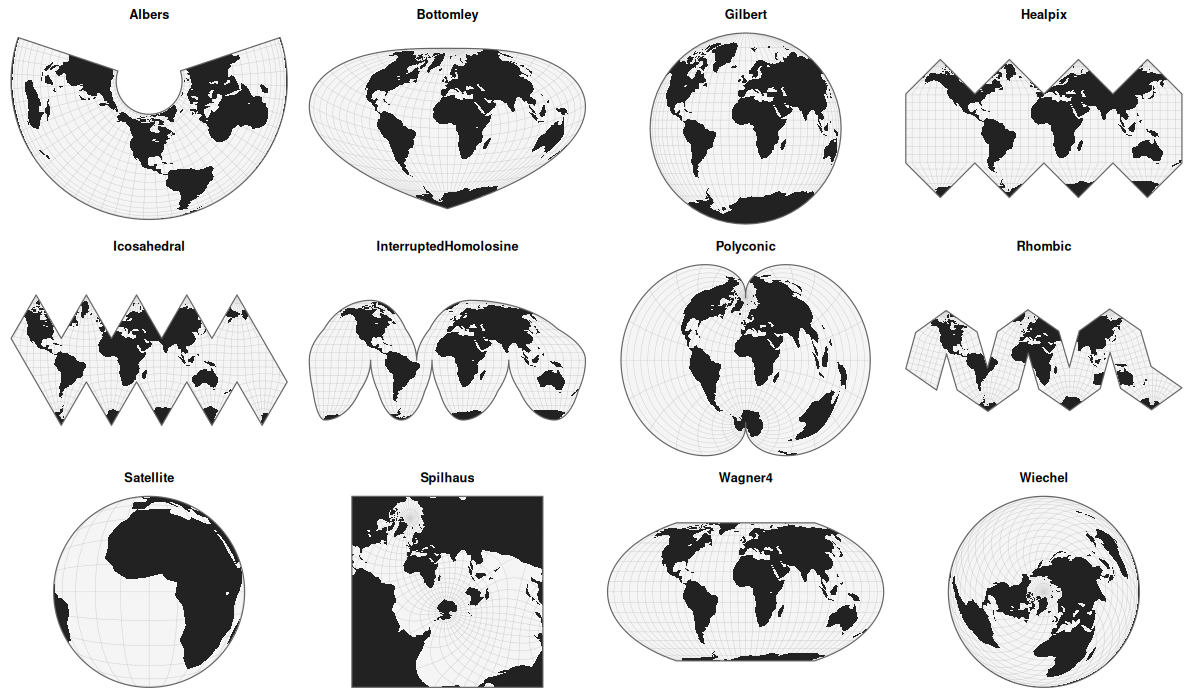
With the gallery() function, you can quickly visualize a set of projections at a glance. By default, the function displays 12 randomly selected projections. Here is an example.
Under the hood
Under the hood, this package executes JavaScript code. It is built on the V8 engine, using a context with default libraries preloaded. However, you can also create a new context and load additional libraries using the new_v8_context() function.
On load, the package exposes the projection functions provided by three JavaScript libraries from the D3 ecosystem. We are grateful to Mike Bostock, Philippe Rivière, Jason Davies, Ricky Reusser, Charles Karney, and all the contributors who have helped develop and maintain these powerful geospatial tools.
-
d3-geo: https://d3js.org/d3-geo/projection -
d3-geo-projection: https://github.com/d3/d3-geo-projection -
d3-geo-polygon: https://github.com/d3/d3-geo-polygon
In addition, a custom script for the Spilhaus projection has been added (thanks to Torben Jansen).
For details on the available projections and their parameters, please refer to the documentation of these libraries. It is all the more interesting that you can directly pass a D3 function with all its parameters.
For example
planisphere::projection(x = world,
                        proj = "AzimuthalEqualArea",
                        rotate = c(-10, -52)
                        )
is equivalent to
planisphere::projection(x = world,
                        proj = "d3.geoAzimuthalEqualArea().rotate([-10, 52])"
                        )
This approach can be much more convenient if you are already familiar with the D3 ecosystem and used to working with it.
Community Guidelines
One can contribute to the package through pull requests and report issues or ask questions here