Plot a layout layer.
layoutLayer(
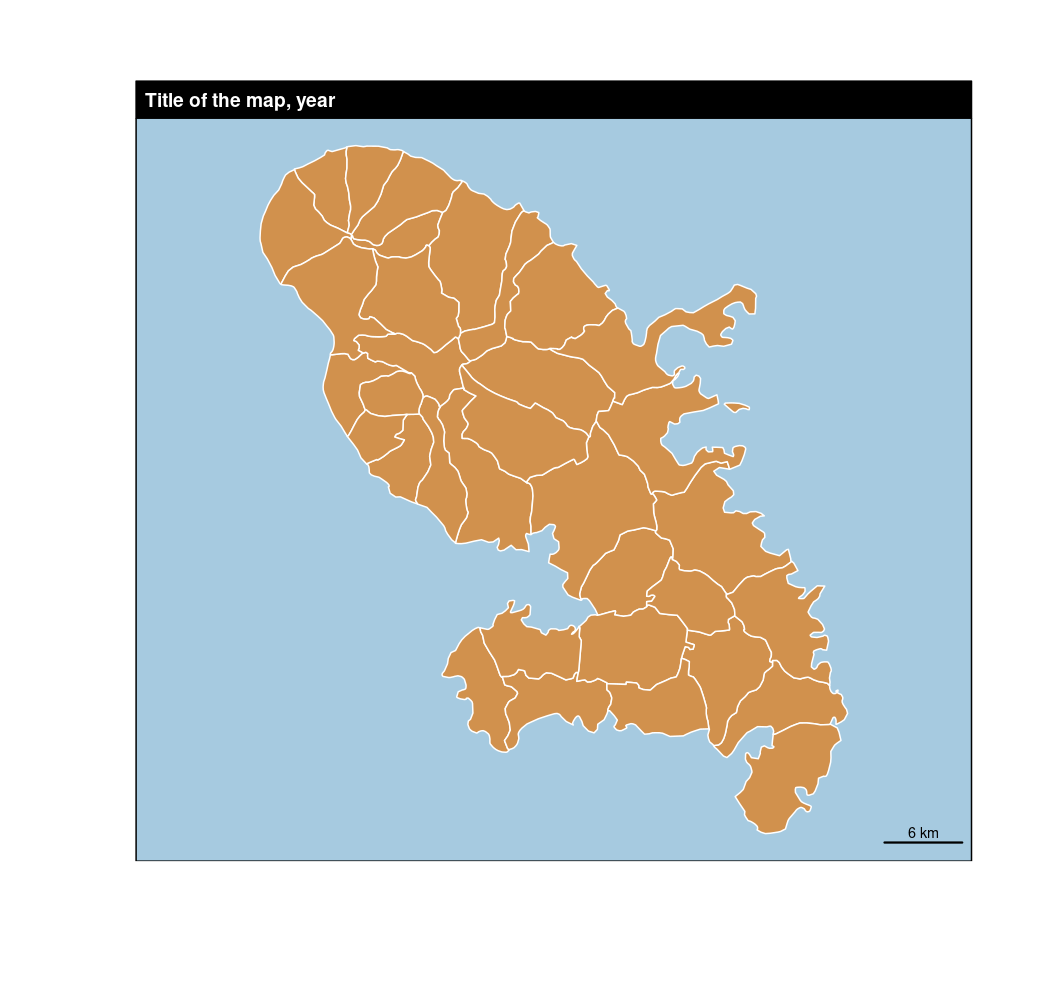
title = "Title of the map, year",
sources = "",
author = "",
horiz = TRUE,
col = "black",
coltitle = "white",
theme = NULL,
bg = NULL,
scale = "auto",
posscale = "bottomright",
frame = TRUE,
north = FALSE,
south = FALSE,
extent = NULL,
tabtitle = FALSE,
postitle = "left"
)Arguments
- title
title of the map.
- sources
sources of the map (or something else).
- author
author of the map (or something else).
- horiz
orientation of sources and author. TRUE for horizontal display on the bottom left corner, FALSE for vertical display on the bottom right corner.
- col
color of the title box and frame border.
- coltitle
color of the title.
- theme
name of a cartographic palette (see carto.pal.info). col and coltitle are set according to the chosen palette.
- bg
color of the frame background.
- scale
size of the scale bar in kilometers. If set to FALSE, no scale bar is displayed, if set to "auto" an automatic size is used (1/10 of the map width).
- posscale
position of the scale, can be "bottomright", "bottomleft" or a vector of two coordinates (c(x, y))
- frame
whether displaying a frame (TRUE) or not (FALSE).
- north
whether displaying a North arrow (TRUE) or not (FALSE).
- south
whether displaying a South arrow (TRUE) or not (FALSE).
- extent
sf object or Spatial*DataFrame; sets the extent of the frame to the one of a spatial object. (optional)
- tabtitle
size of the title box either a full banner (FALSE) or a "tab" (TRUE).
- postitle
position of the title, one of "left", "center", "right".
Details
If extent is not set, plot.new has to be called first.
The size of the title box in layoutLayer is fixed to 1.2 lines height.
See also
Examples
library(sf)
mtq <- st_read(system.file("gpkg/mtq.gpkg", package="cartography"))
#> Reading layer `mtq' from data source
#> `/tmp/RtmpmpfIrO/temp_libpath18ee15f22a9e/cartography/gpkg/mtq.gpkg'
#> using driver `GPKG'
#> Simple feature collection with 34 features and 7 fields
#> Geometry type: MULTIPOLYGON
#> Dimension: XY
#> Bounding box: xmin: 690574 ymin: 1592536 xmax: 735940.2 ymax: 1645660
#> Projected CRS: WGS 84 / UTM zone 20N
plot(st_geometry(mtq), col = "#D1914D", border = "white", bg = "#A6CAE0")
# Layout plot
layoutLayer()
 plot(st_geometry(mtq), col = "#D1914D", border = "white", bg = "#A6CAE0")
# Layout plot
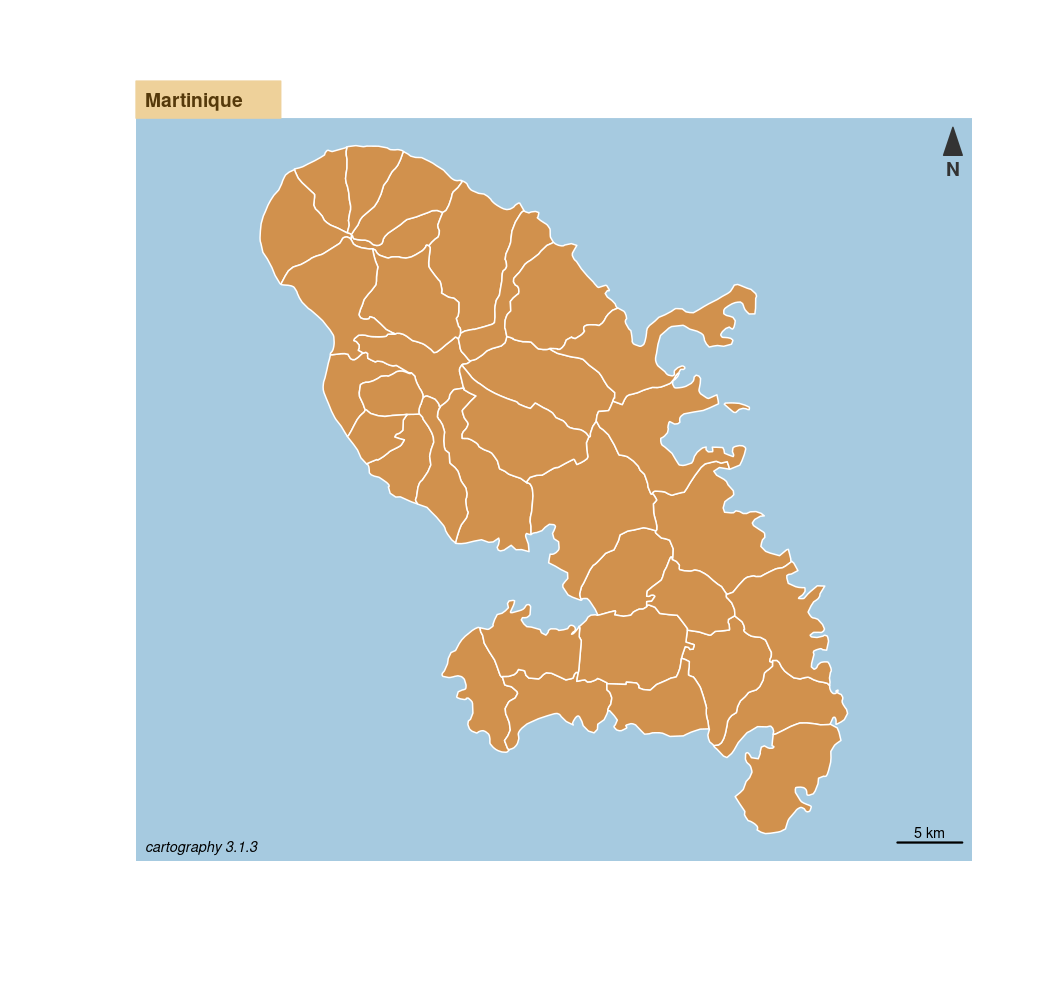
layoutLayer(title = "Martinique",
author = paste0("cartography ", packageVersion("cartography")),
tabtitle = TRUE, scale = 5, north = TRUE, frame = FALSE,
theme = "sand.pal")
plot(st_geometry(mtq), col = "#D1914D", border = "white", bg = "#A6CAE0")
# Layout plot
layoutLayer(title = "Martinique",
author = paste0("cartography ", packageVersion("cartography")),
tabtitle = TRUE, scale = 5, north = TRUE, frame = FALSE,
theme = "sand.pal")