Plot legend for hatched maps.
legendHatched(
  pos = "topleft",
  title.txt = "Title of the legend",
  title.cex = 0.8,
  values.cex = 0.6,
  categ,
  patterns,
  ptrn.bg = "white",
  ptrn.text = "X",
  dot.cex = 0.5,
  text.cex = 0.5,
  cex = 1,
  frame = FALSE,
  ...
)
Arguments
- pos
position of the legend, one of "topleft", "top", "topright", "right", "bottomright", "bottom", "bottomleft", "bottomleftextra", "left" or a vector of two coordinates in map units (c(x, y)).
- title.txt
title of the legend.
- title.cex
size of the legend title.
- values.cex
size of the values in the legend.
- categ
vector of categories.
- patterns
vector of patterns to be created for each element on
categ, see hatchedLayer.- ptrn.bg
background of the legend box for each
categ.- ptrn.text
text to be used for each
categ="text", as a single value or a vector.- dot.cex
cex of each
patterns = "dot"categories, as a single value or a vector.- text.cex
text size of each
patterns = "text"categories, as a single value or a vector.- cex
size of the legend. 2 means two times bigger.
- frame
whether to add a frame to the legend (TRUE) or not (FALSE).
- ...
optional graphical parameters, see details on hatchedLayer
Note
It is also possible to create solid legends, by setting col and ptrn.bg to the same color.
Parameters would honour the order of the categ variable.
See also
Examples
library(sf)
mtq <- st_read(system.file("gpkg/mtq.gpkg", package = "cartography"))
#> Reading layer `mtq' from data source
#> `/tmp/RtmpmpfIrO/temp_libpath18ee15f22a9e/cartography/gpkg/mtq.gpkg'
#> using driver `GPKG'
#> Simple feature collection with 34 features and 7 fields
#> Geometry type: MULTIPOLYGON
#> Dimension: XY
#> Bounding box: xmin: 690574 ymin: 1592536 xmax: 735940.2 ymax: 1645660
#> Projected CRS: WGS 84 / UTM zone 20N
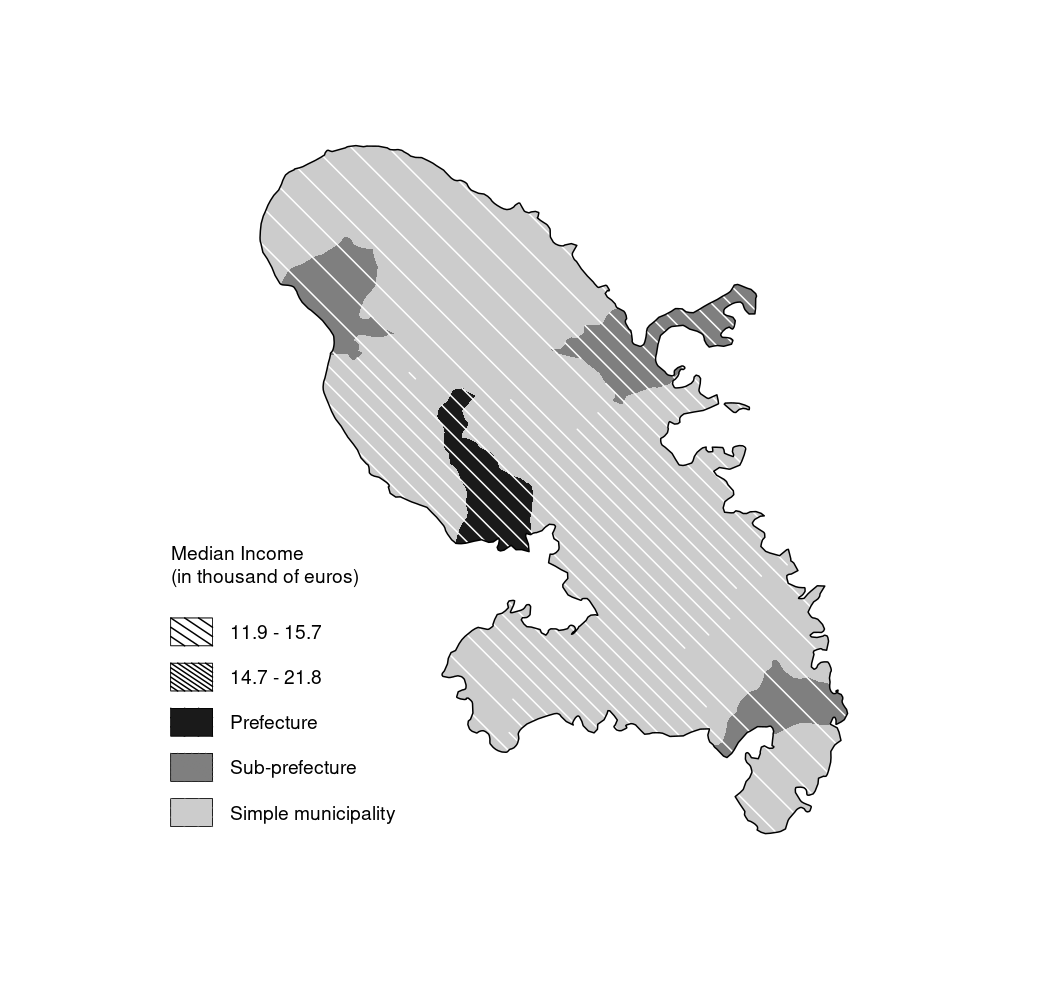
typoLayer(mtq, var = "STATUS", legend.pos = "n",
legend.values.order = c("Prefecture","Sub-prefecture",
"Simple municipality"),
col = c("grey10", "grey50", "grey80"),border = NA)
mtq$Patts = cut(mtq$MED,c(-Inf,15700,Inf), labels=FALSE)
hatchedLayer(mtq[mtq$Patts == 1,],"left2right",
density = 2, col = "white", add = TRUE, pch = 3, cex = 0.6)
hatchedLayer(mtq[mtq$Patts == 2, ],"left2right",
density = 4, col = "white", add = TRUE)
legendHatched(pos = "bottomleft",
cex = 1.5,
values.cex = 0.8,
title.txt = "Median Income\n(in thousand of euros)",
categ = c("11.9 - 15.7","14.7 - 21.8",
"Prefecture", "Sub-prefecture",
"Simple municipality"),
patterns = c("left2right"), density = c(1, 2),
col = c(rep("black", 2), "grey10", "grey50", "grey80"),
ptrn.bg = c(rep("white", 2), "grey10", "grey50", "grey80"),
pch = 3)
plot(st_geometry(st_union(mtq)), add = TRUE)