This function is deprecated. Please use mf_text instead. instead.
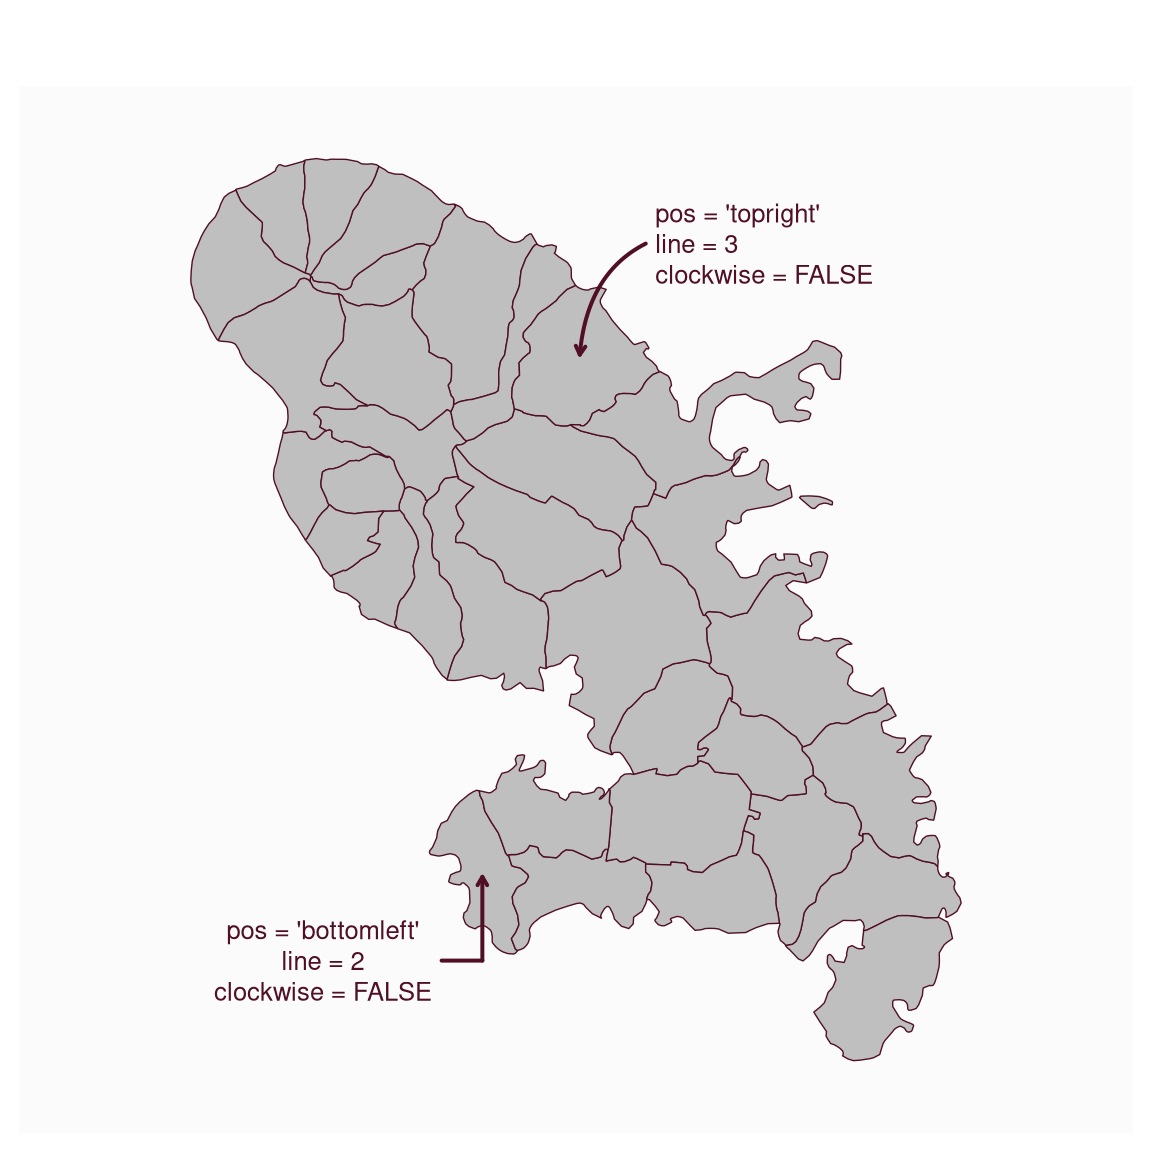
Plot an annotation on a map.
Usage
mf_annotation(
  x,
  txt,
  pos = "topright",
  cex = 0.8,
  col_arrow,
  col_txt,
  halo = FALSE,
  bg,
  s = 1,
  ...
)
Arguments
- x
an sf object with 1 row, a couple of coordinates (c(x, y)) or "interactive"
- txt
the text to display
- pos
position of the text, one of "topleft", "topright", "bottomright", "bottomleft" or "center"
- cex
size of the text
- col_arrow
arrow color, hex code or color name given by colors. The default color is the highlight color (see mf_theme).
- col_txt
text color, hex code or color name given by colors. The default color is the highlight color (see mf_theme).
- halo
add a halo around the text
- bg
halo color, hex code or color name given by colors. The default color is the background color (see mf_theme).
- s
arrow size (min=1)
- ...
further text arguments.
Examples
mtq <- mf_get_mtq()
mf_map(mtq)
mf_text(
  x = mtq[2, ],
  txt = "pos = 'bottomleft'\nline = 2\nclockwise = FALSE",
  pos = "bottomleft",
  offset = 6,
  clockwise = FALSE,
  line = 2,
  box = FALSE
)
mf_text(
  x = mtq[28, ],
  txt = "pos = 'topright'\nline = 3\nclockwise = FALSE",
  pos = "topright",
  offset = 10,
  clockwise = FALSE,
  line = 3,
  halo = TRUE,
  align = "left"
)