Plot a north arrow.
Usage
mf_arrow(pos = "topleft", col, cex = 1, adj = c(0, 0), align)Arguments
- pos
position. It can be one of 'topleft', 'top','topright', 'right', 'bottomright', 'bottom','bottomleft', 'left', 'interactive' or a vector of two coordinates in map units (c(x, y))
- col
arrow color, hex code or color name given by colors. The default color is the highlight color (see mf_theme).
- cex
arrow size
- adj
adjust the position of the north arrow in x and y directions
- align
object of class
sforsfcused to adjust the arrow to the real north
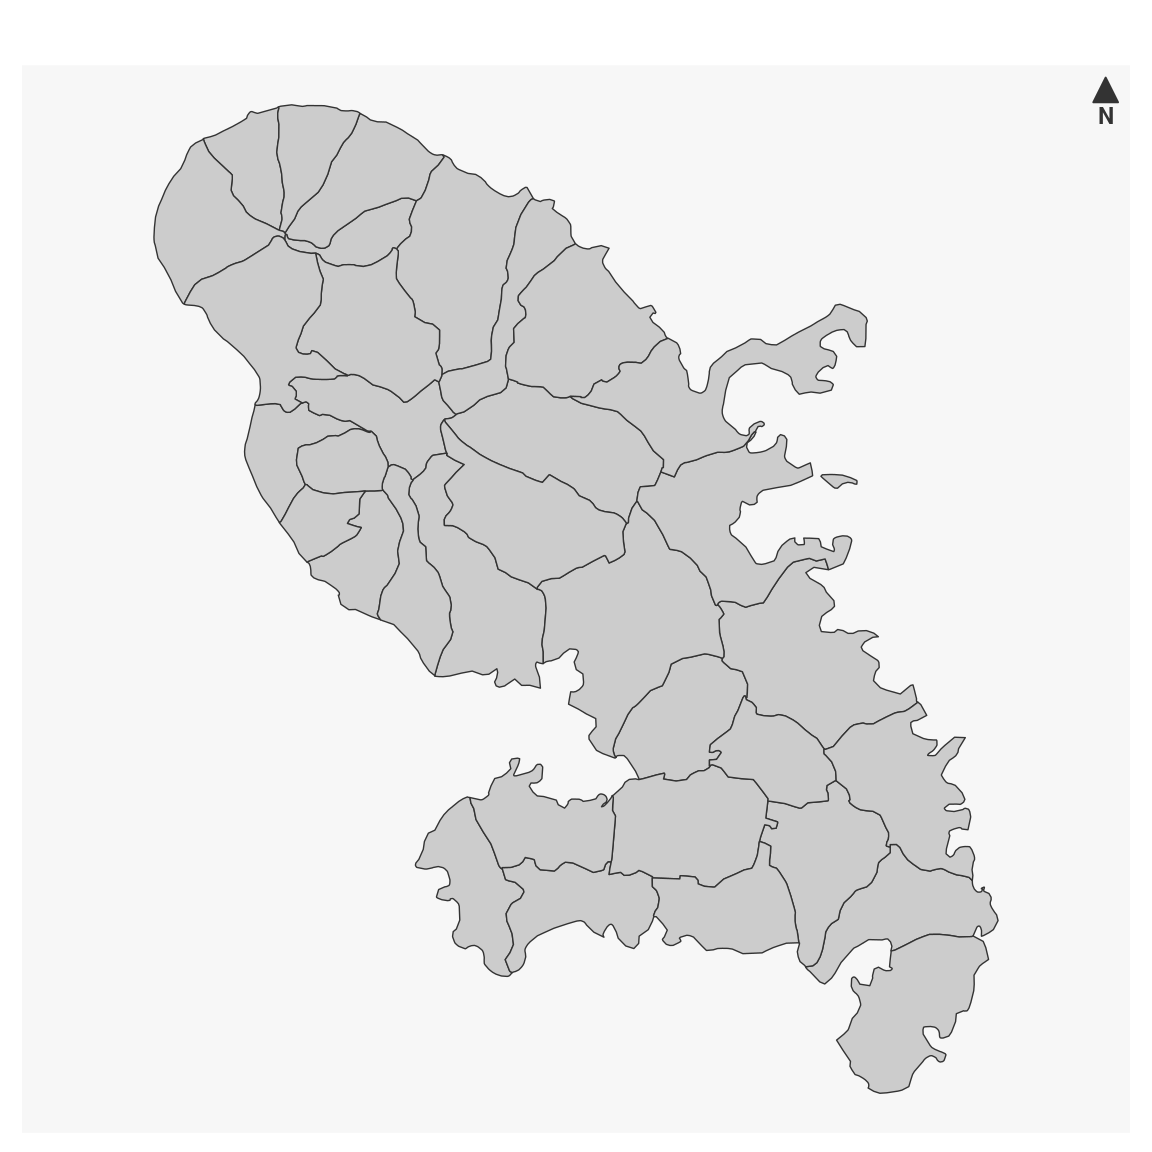
Examples
mtq <- mf_get_mtq()
mf_map(mtq)
mf_arrow(pos = "topright")