This function is deprecated. Please use mf_map() with type = "choro"
instead.
Plot a choropleth map
Usage
mf_choro(
  x,
  var,
  pal,
  alpha = NULL,
  rev = FALSE,
  breaks = "quantile",
  nbreaks,
  border,
  pch = 21,
  cex = 2,
  lwd = 0.7,
  col_na = "white",
  extent = x,
  bg,
  expandBB = rep(0.04, 4),
  leg_pos = mf_get_leg_pos(x),
  leg_title = var,
  leg_title_cex = 0.8,
  leg_val_cex = 0.6,
  leg_val_rnd = 2,
  leg_val_dec = ".",
  leg_val_big = "",
  leg_no_data = "No data",
  leg_frame = FALSE,
  leg_horiz = FALSE,
  leg_adj = c(0, 0),
  leg_size = 1,
  leg_box_border,
  leg_box_cex = c(1, 1),
  leg_fg,
  leg_bg,
  leg_frame_border,
  add = FALSE
)
Arguments
- x
object of class
sf- var
name(s) of the variable(s) to plot
- pal
a set of colors (hex codes) or a palette name (valid palette names can be obtained with
hcl.pals).- alpha
opacity, in the range 0,1
- rev
if
palis a valid palette name, whether the ordering of the colors should be reversed (TRUE) or not (FALSE)- breaks
either a numeric vector with the actual breaks, or a classification method name (see mf_get_breaks and Details)
- nbreaks
number of classes
- border
border color
- pch
pch type of pch if x is a POINT layer
- cex
cex cex of the symbols if x is a POINT layer
- lwd
border width
- col_na
color for missing values
- leg_pos
position of the legend, one of 'topleft', 'top','topright', 'right', 'bottomright', 'bottom', 'bottomleft', 'left' or a vector of two coordinates in map units (c(x, y)). Use
NAto avoid plotting the legend, use 'interactive' to choose the legend position by clicking on the map.- leg_title
legend title
- leg_title_cex
size of the legend title
- leg_val_cex
size of the values in the legend
- leg_val_rnd
number of decimal places of the values in the legend
- leg_val_dec
decimal separator
- leg_val_big
thousands separator
- leg_no_data
label for missing values
- leg_frame
whether to add a frame to the legend (TRUE) or not (FALSE)
- leg_horiz
display the legend horizontally (for proportional symbols and choropleth types)
- leg_adj
adjust the position of the legend in x and y directions
- leg_size
size of the legend; 2 means two times bigger
- leg_box_border
border color of legend boxes
- leg_box_cex
width and height size expansion of boxes
- leg_fg
color of the legend foreground
- leg_bg
color of the legend background
- leg_frame_border
border color of the legend frame
- add
whether to add the layer to an existing plot (TRUE) or not (FALSE)
Details
Breaks defined by a numeric vector or a classification method are
left-closed: breaks defined by c(2, 5, 10, 15, 20)
will be mapped as [2 - 5[, [5 - 10[, [10 - 15[, [15 - 20].
The "jenks" method is an exception and has to be right-closed.
Jenks breaks computed as c(2, 5, 10, 15, 20)
will be mapped as [2 - 5], ]5 - 10], ]10 - 15], ]15 - 20].
Examples
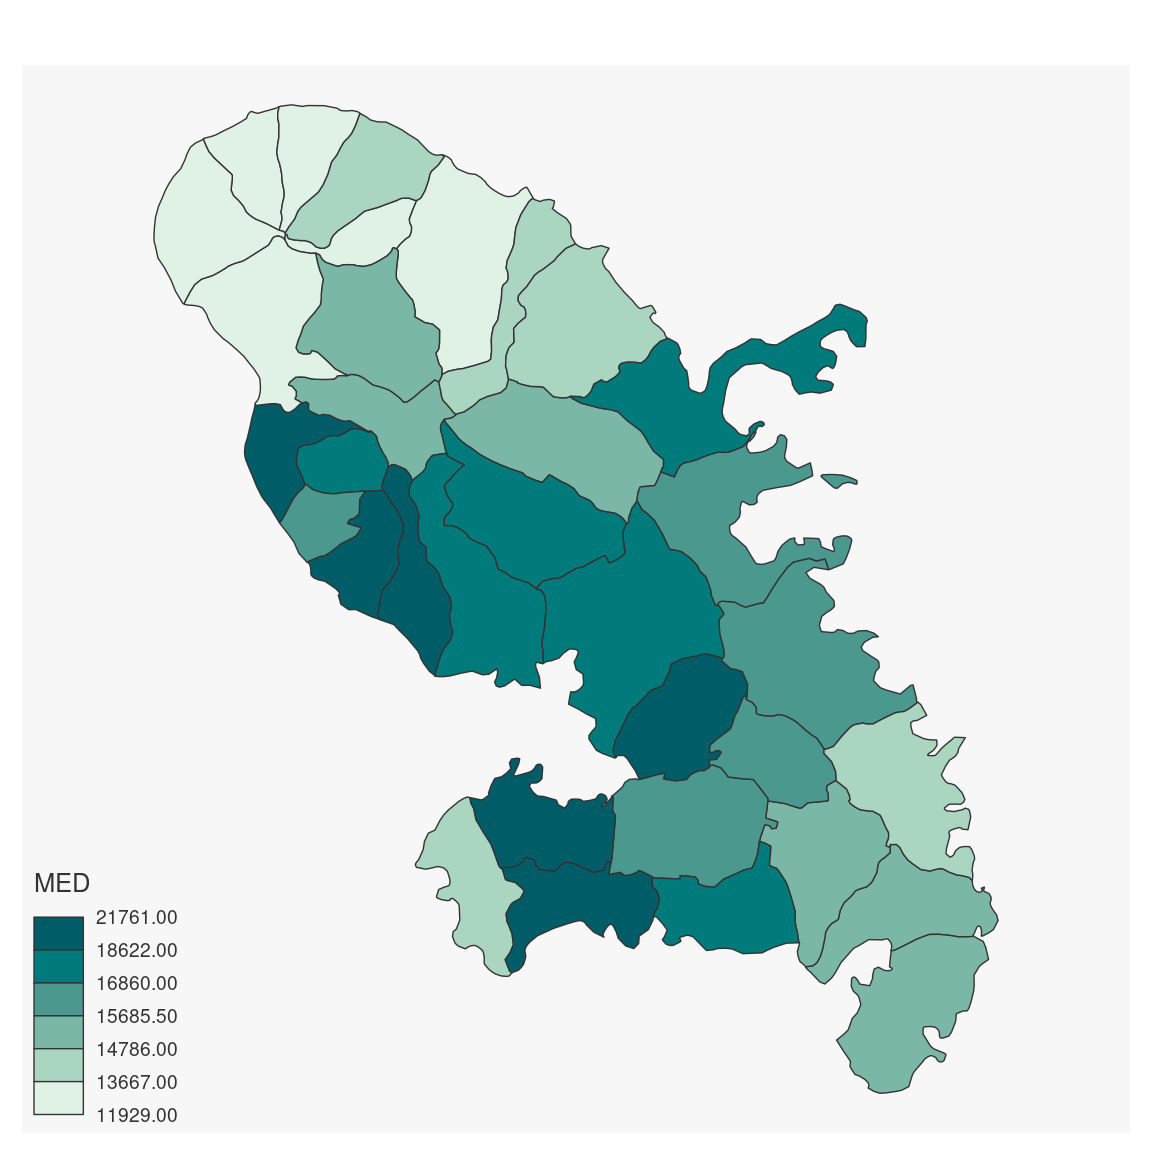
mtq <- mf_get_mtq()
mf_map(mtq, var = "MED", type = "choro")
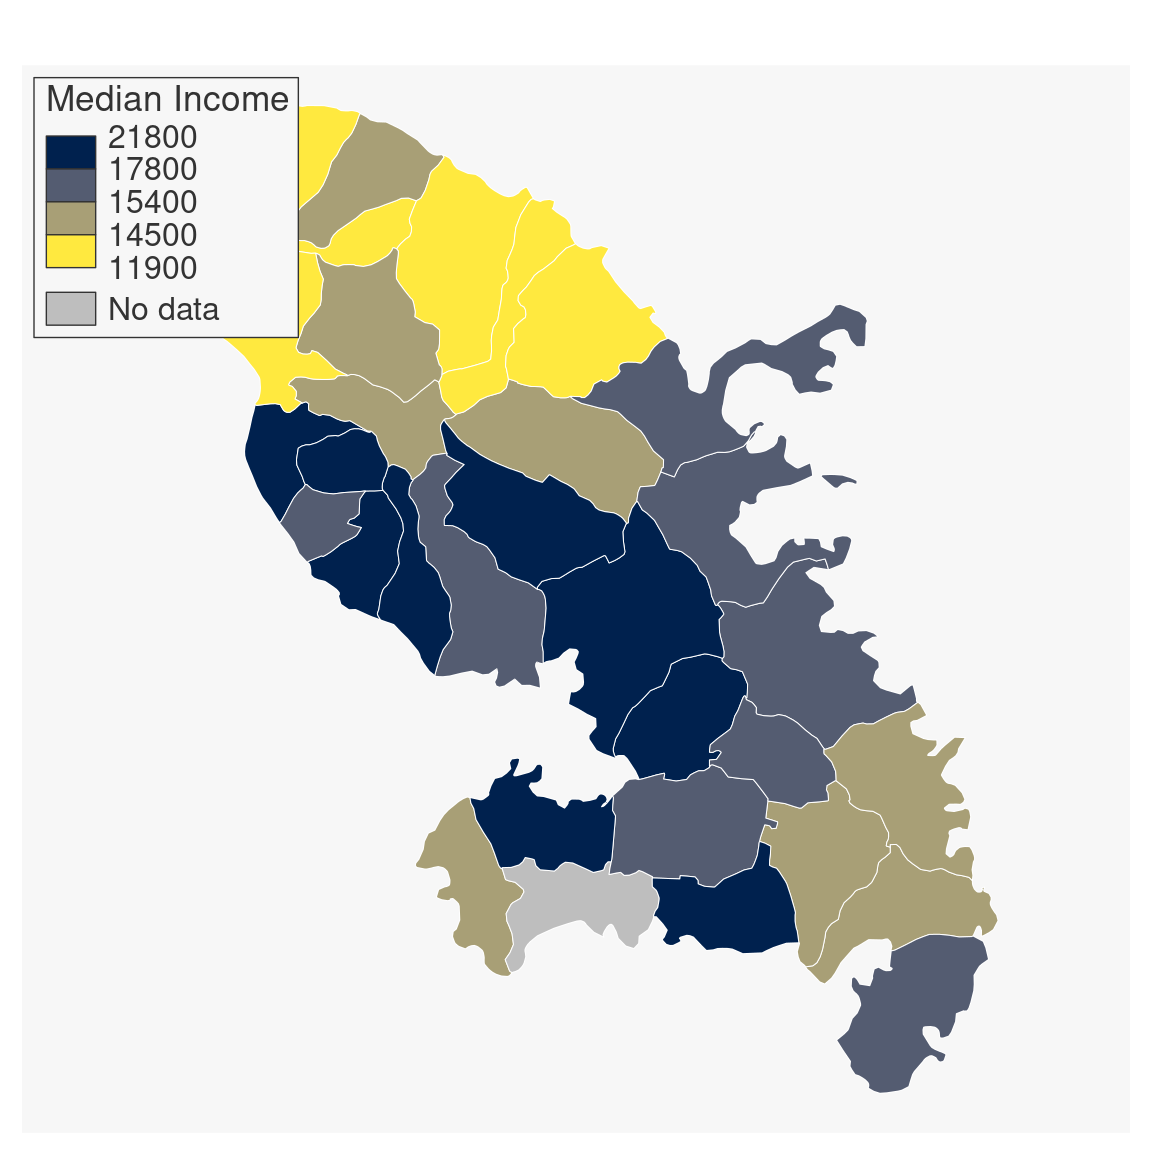
 mtq[6, "MED"] <- NA
mf_map(
x = mtq, var = "MED", type = "choro",
col_na = "grey", pal = "Cividis",
breaks = "quantile", nbreaks = 4, border = "white",
lwd = .5, leg_pos = "topleft",
leg_title = "Median Income", leg_title_cex = 1.1,
leg_val_cex = 1, leg_val_rnd = -2, leg_no_data = "No data",
leg_frame = TRUE
)
mtq[6, "MED"] <- NA
mf_map(
x = mtq, var = "MED", type = "choro",
col_na = "grey", pal = "Cividis",
breaks = "quantile", nbreaks = 4, border = "white",
lwd = .5, leg_pos = "topleft",
leg_title = "Median Income", leg_title_cex = 1.1,
leg_val_cex = 1, leg_val_rnd = -2, leg_no_data = "No data",
leg_frame = TRUE
)