This function displays the statistical distribution of a variable with a histogram, a box plot, a strip chart and a density curve on the same plot.
This graphic can be useful to choose an appropriate classification method for choropleth maps.
User-defined class boundaries can also be displayed on the plot.
Usage
mf_distr(
  x,
  nbins,
  bw,
  breaks,
  pal,
  alpha = 1,
  rev = FALSE,
  main = "Distribution",
  yaxt = TRUE,
  ylab = "Density"
)
Arguments
- x
a numeric variable
- nbins
number of bins in the histogram
- bw
bandwidth of the density curve
- breaks
a vector of class boundaries. If
breaksis used, the boxplot is not displayed.- pal
a color, a set of colors (hex codes) or a palette name. Palette names can be obtained with hcl.pals. The default color is either the highlight color if
breaksis not used, or the background color otherwise (see mf_theme).- alpha
opacity, in the range [0,1] (0 means transparent and 1 means opaque). Default is set to 1.
- rev
logical indicating whether the ordering of the colors should be reversed
- main
plot title
- yaxt
if FALSE the y axis is not displayed
- ylab
y axis label
Value
The number of bins of the histogram and the bandwidth of the density curve are (invisibly) returned in a list.
Examples
(mf_distr(rnorm(1000)))
 #> $bw
#> [1] 0.2832403
#>
#> $nbins
#> [1] 10
#>
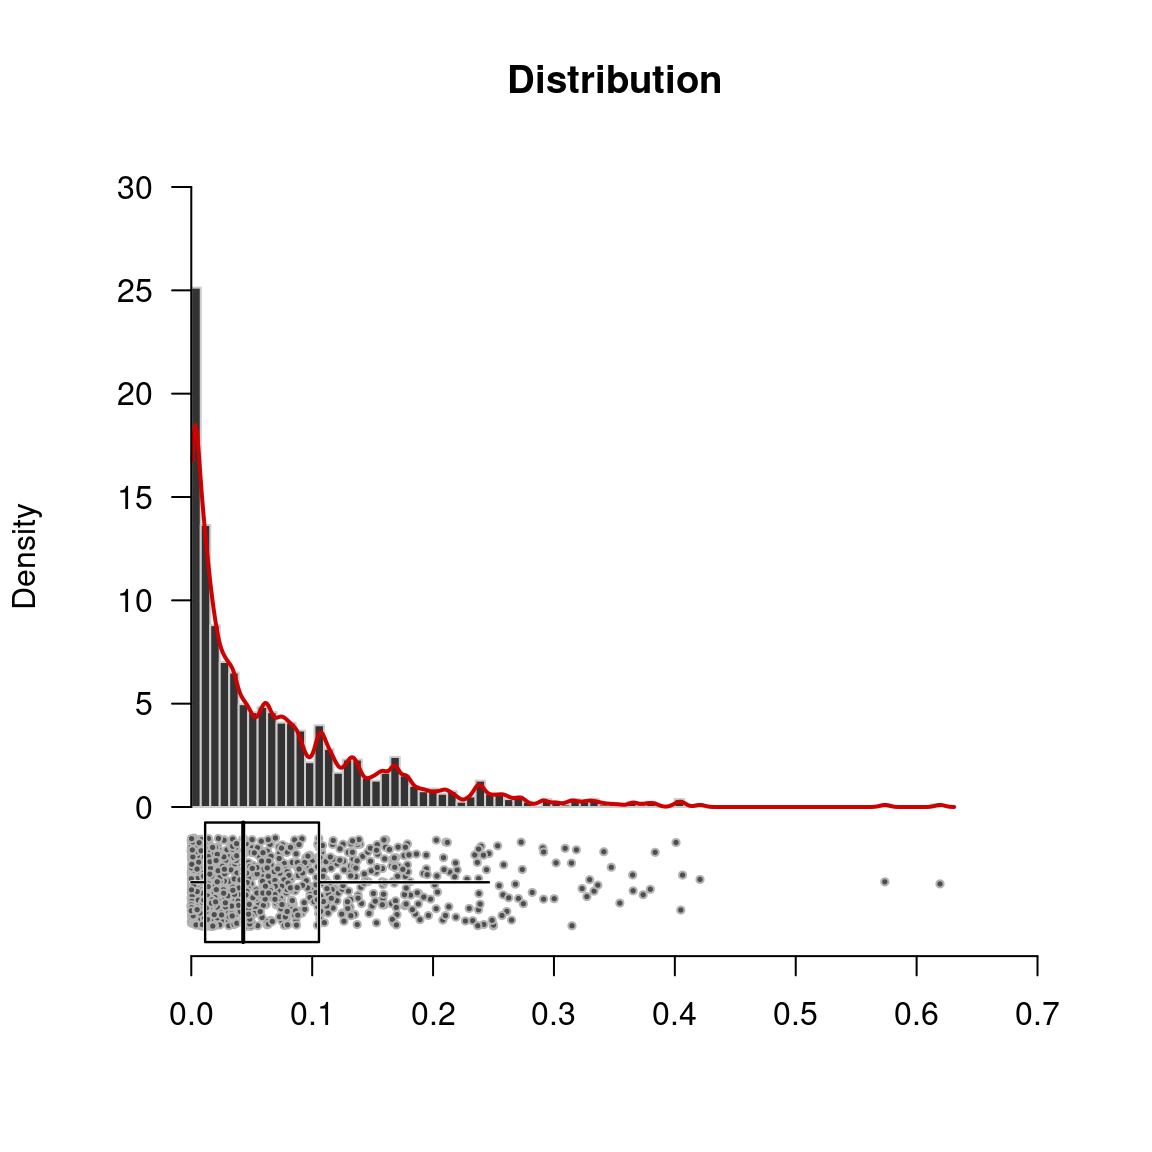
mf_distr(rbeta(1000, .6, 7))
#> $bw
#> [1] 0.2832403
#>
#> $nbins
#> [1] 10
#>
mf_distr(rbeta(1000, .6, 7))
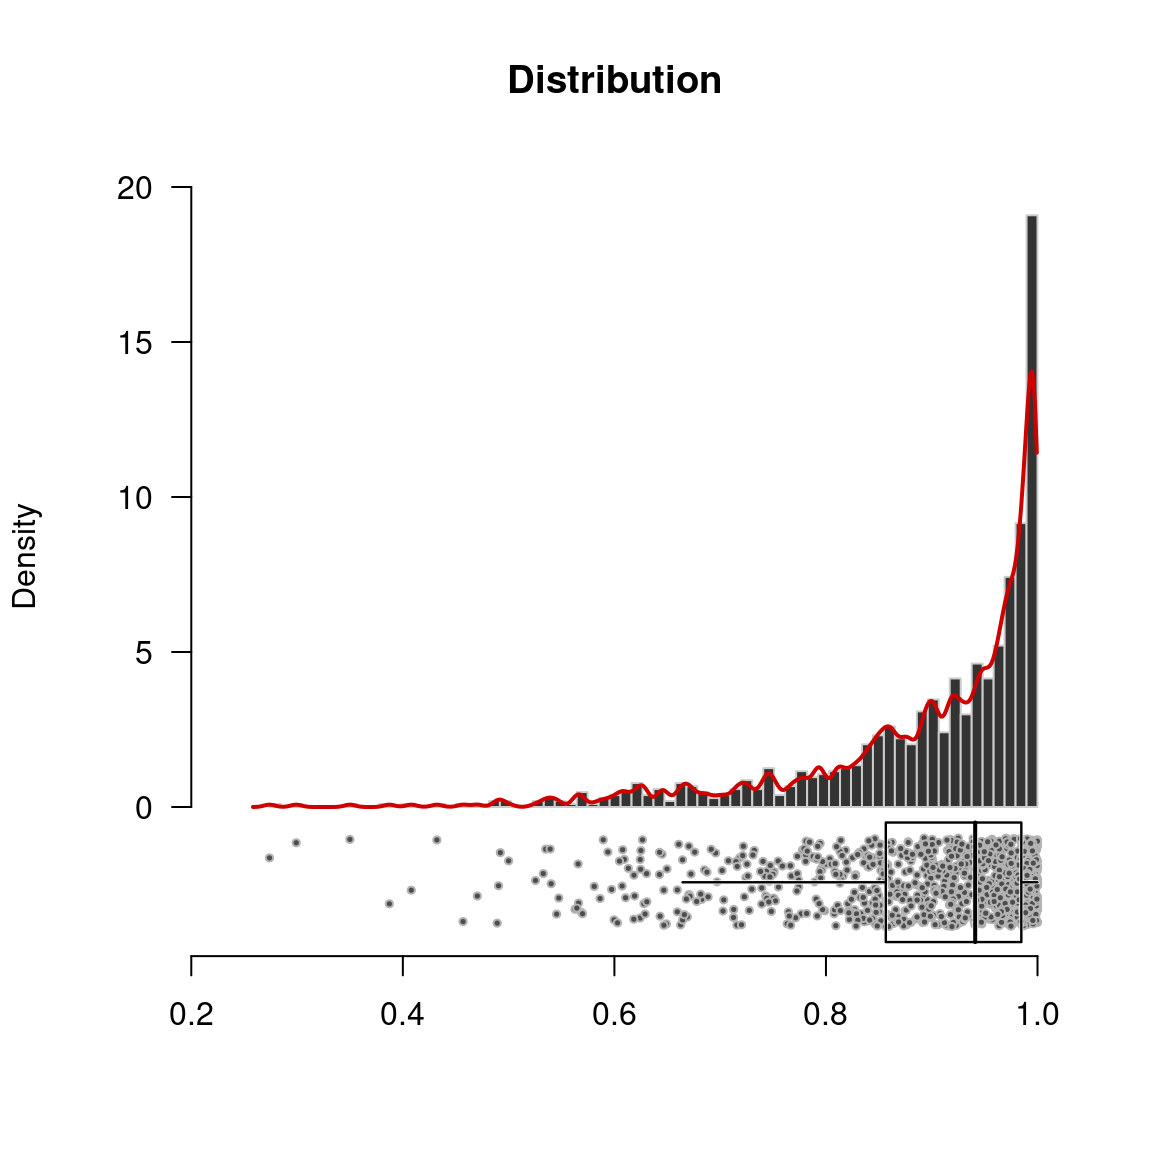
 mf_distr(rbeta(1000, 5, .6))
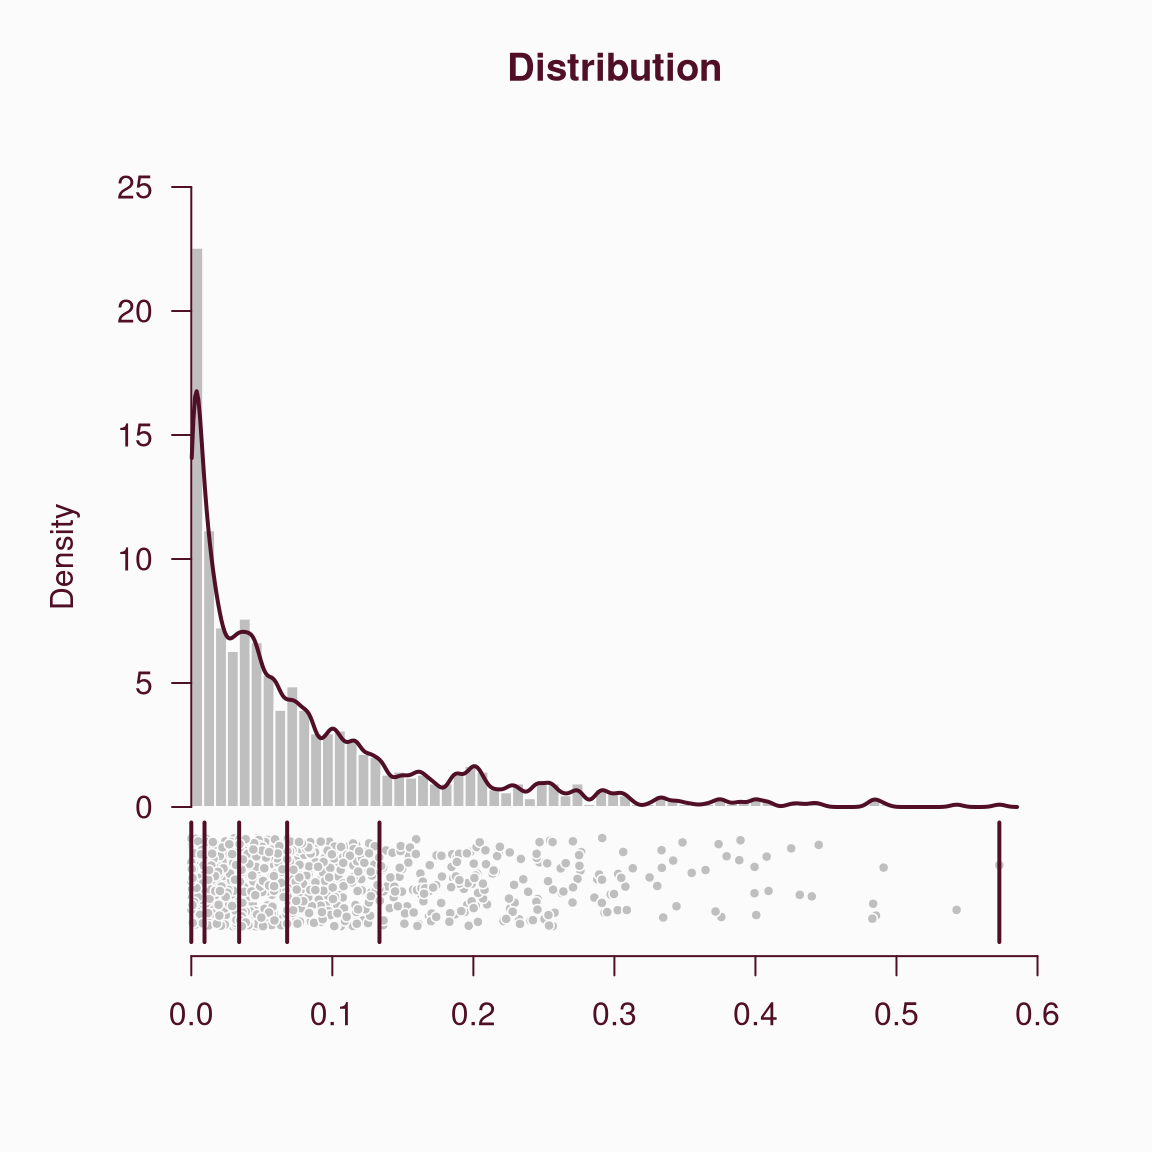
 a <- rbeta(1000, .6, 7)
bks <- mf_get_breaks(a, nbreaks = 5, breaks = "quantile")
mf_distr(a, breaks = bks)
a <- rbeta(1000, .6, 7)
bks <- mf_get_breaks(a, nbreaks = 5, breaks = "quantile")
mf_distr(a, breaks = bks)
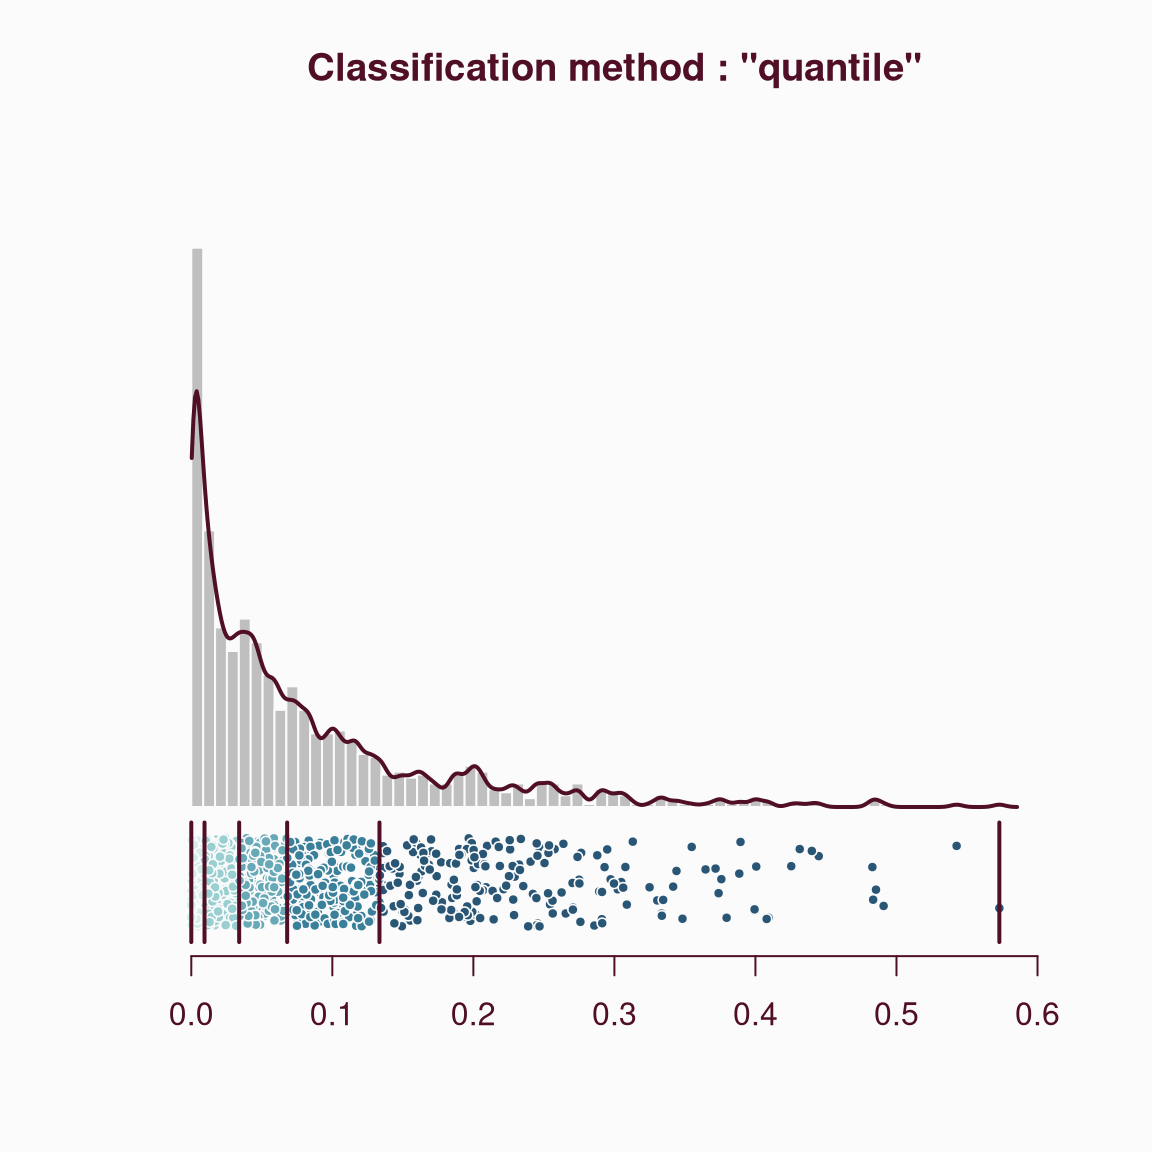
 mf_distr(a,
breaks = bks, pal = "Teal", yaxt = FALSE,
main = 'Classification method : "quantile"'
)
mf_distr(a,
breaks = bks, pal = "Teal", yaxt = FALSE,
main = 'Classification method : "quantile"'
)