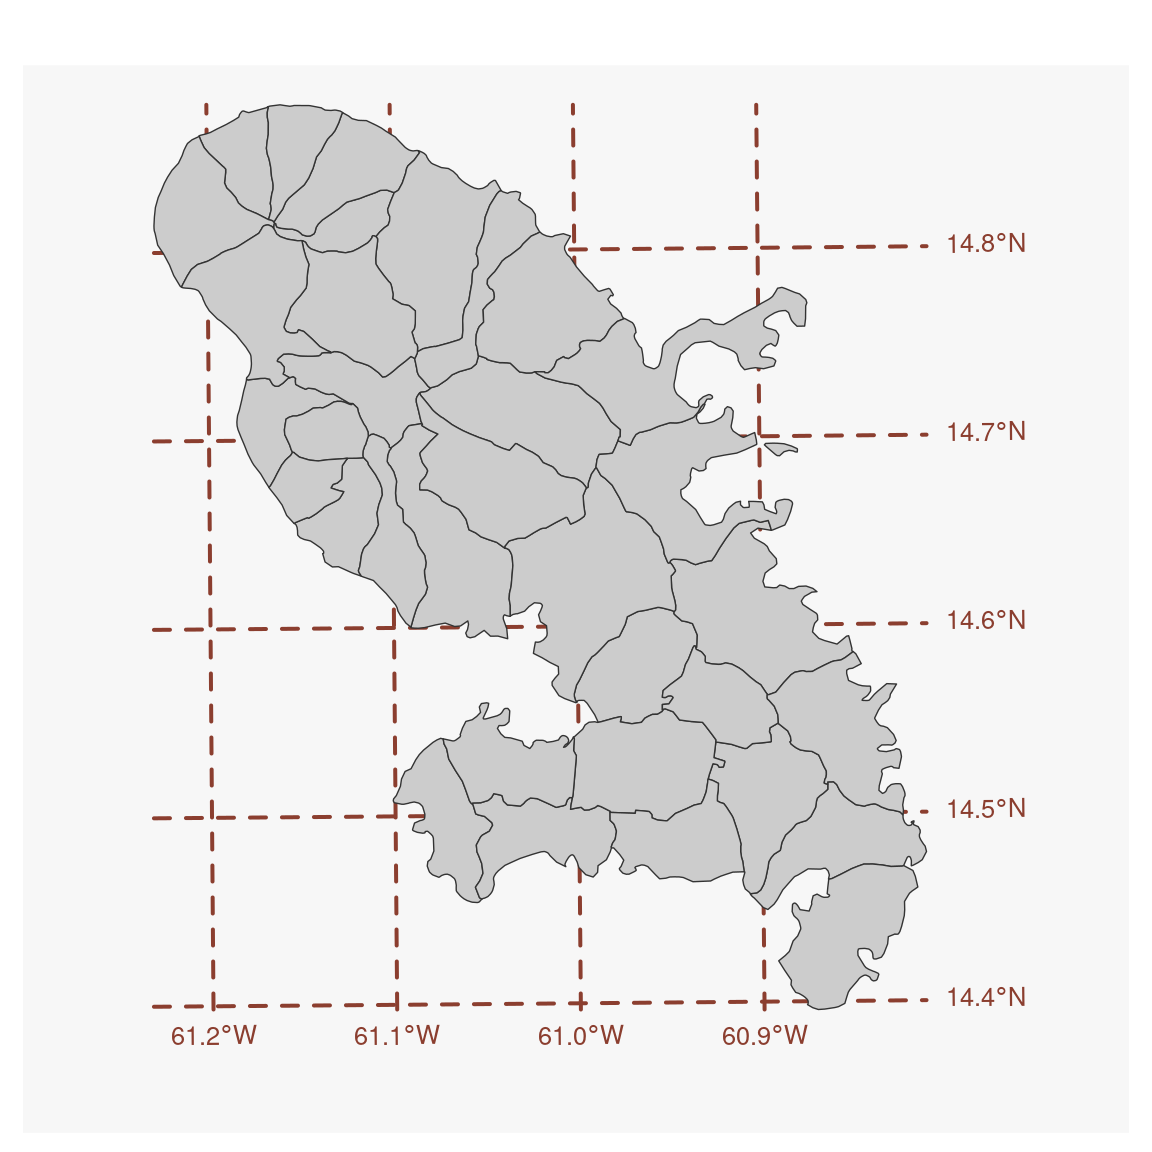
Display graticules and labels on a map.
Arguments
- x
object of class
sf,sfcorSpatRaster- col
graticules and labels color, hex code or color name given by colors. The default color is the highlight color (see mf_theme).
- lwd
graticules line width
- lty
graticules line type
- expandBB
expension of the map area in each direction (bottom, left, top, right). The expension is expressed as a share of
xwidth (for left and right values) or a share ofxheight (for bottom and top values).- label
whether to add labels (TRUE) or not (FALSE)
- pos
labels positions ("bottom", "left", "top" and / or "right")
- cex
labels size
- extent
sfobject used to define the map extent; defaults tox.extentandxmust use the same CRS.- bg
background color of the map, hex code or color name given by colors, ignored if
add = TRUE- add
whether to add the layer to an existing plot (TRUE) or not (FALSE)
Use of graticules
From sf::st_graticule():
"In cartographic visualization, the use of graticules is not advised, unless
the graphical output will be used for measurement or navigation, or the
direction of North is important for the interpretation of the content, or
the content is intended to display distortions and artifacts created by
projection. Unnecessary use of graticules only adds visual clutter but
little relevant information. Use of coastlines, administrative boundaries
or place names permits most viewers of the output to orient themselves
better than a graticule."