With the grad map type, mf_map() displays graduated symbols on a map.
Graduated symbols are based on classified quantitative variables.
For polygons, centroids are used to plot graduated symbols.
Usage
For polygons and points:
mf_map(x, var, type = "grad",
       breaks = "quantile", nbreaks = 3,
       col, border, lwd = 0.7, pch = 21, cex,
       alpha, expandBB, extent, bg, add = TRUE, leg_*)
For lines:
mf_map(x, var, type = "grad",
       breaks = "quantile", nbreaks = 3,
       col, lwd,
       alpha, expandBB, extent, bg, add = TRUE, leg_*)
Arguments
- x
object of class
sf- var
name of the variable to map
- type
"grad"
- breaks
either a numeric vector with the actual breaks, or a classification method name. The main methods are 'quantile', 'equal', 'msd', 'ckmeans' (natural breaks), 'Q6' and 'geom'. See mf_get_breaks for details.
- nbreaks
number of classes
- col
color of the graduated symbols or lines, a hex code or a color name given by colors. The default color is the highlight color (see mf_theme).
- border
border color for symbols, a hex code or color name given by colors. The default color is the background color (see mf_theme).
- lwd
border width for graduated symbols, a vector of line widths for graduated lines
- pch
type of symbol to use for points, see pch (points only)
- cex
a vector of sizes for symbols (points only)
- alpha, expandBB, extent, bg, add
arguments described in mf_map
- leg_*
legend arguments described in mf_map
Examples
mtq <- mf_get_mtq()
flows <- mf_get_mtq("lines")
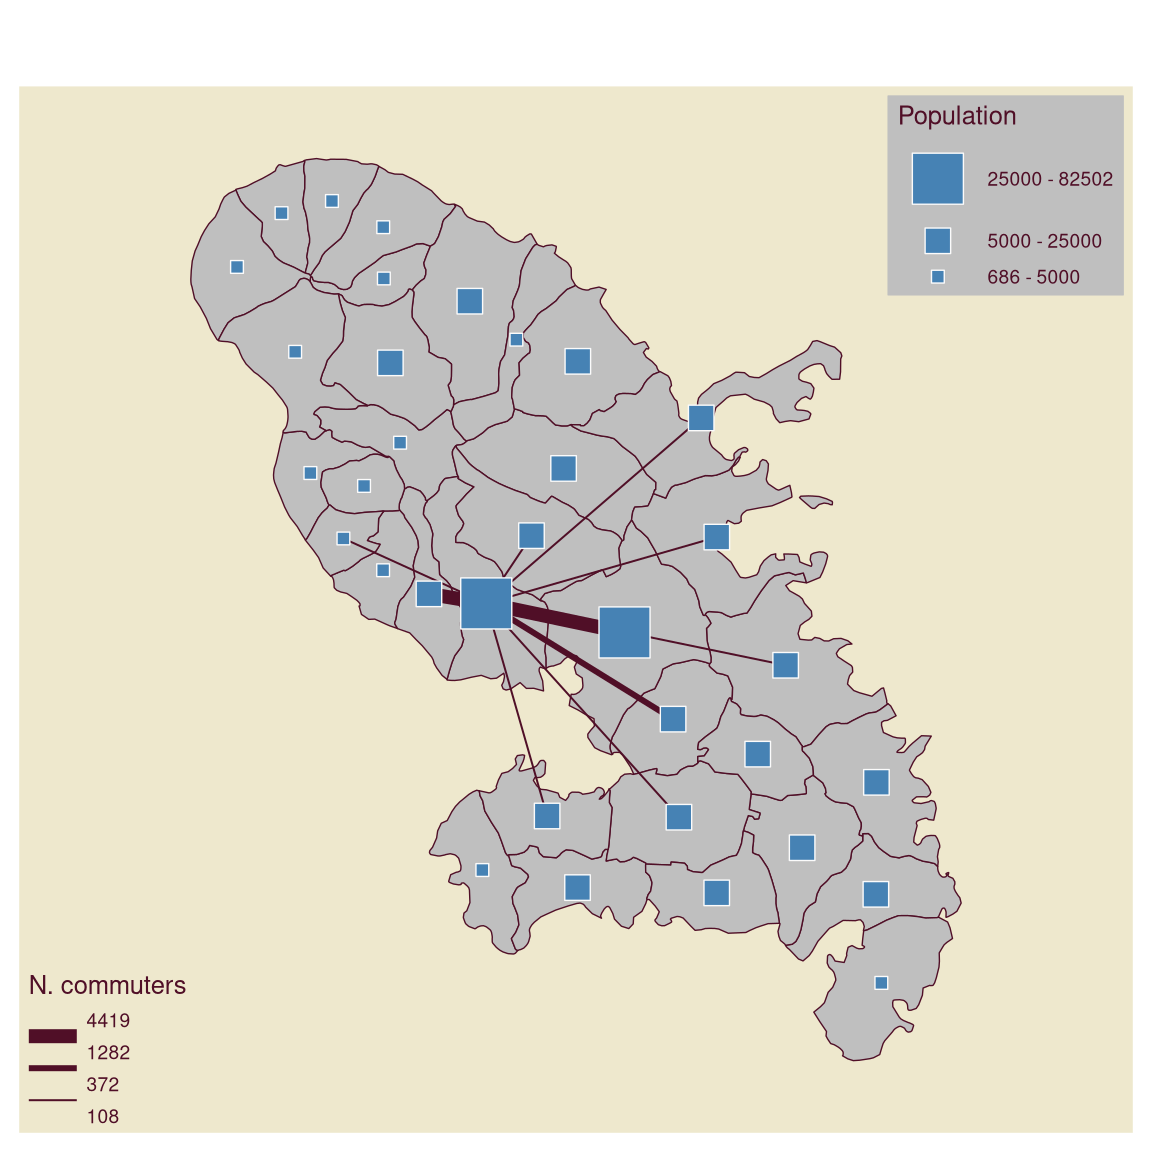
mf_map(mtq, bg = "cornsilk2")
mf_map(flows, "fij", "grad",
breaks = "geom", nbreaks = 3,
lwd = c(1, 3, 7),
leg_title = "N. commuters",
leg_pos = "bottomleft", leg_val_rnd = 0
)
mf_map(mtq, "POP", "grad",
breaks = c(686, 5000, 25000, 82502),
cex = c(1, 2, 4), pch = 22, col = "steelblue",
leg_title = "Population", leg_pos = "topright",
leg_frame = TRUE
)