With the prop map type, mf_map() displays symbols (squares or circles)
with areas proportional to a quantitative variable (stocks).
For polygons, centroids are used to plot proportional symbols.
Arguments
- x
object of class
sf- var
name of the variable to map
- type
"prop"
- inches
size of the largest symbol in inches (radius for circles, half width for squares)
- val_max
maximum value corresponding to the largest symbol or line
- lwd_max
width of the largest line
- symbol
type of proportional symbols, either "circle" or "square"
- col
color of the proportional symbols or lines, a hex code or a color name given by colors. The default color is the highlight color (see mf_theme).
- border
border color for proportional symbols, a hex code or color name given by colors. The default color the background color (see mf_theme).
- lwd
border width of proportional symbols
- alpha, expandBB, extent, bg, add
arguments described in mf_map
- leg_*
legend arguments described in mf_map
Examples
mtq <- mf_get_mtq()
flows <- mf_get_mtq("lines")
mtq <- mf_get_mtq()
mf_map(mtq)
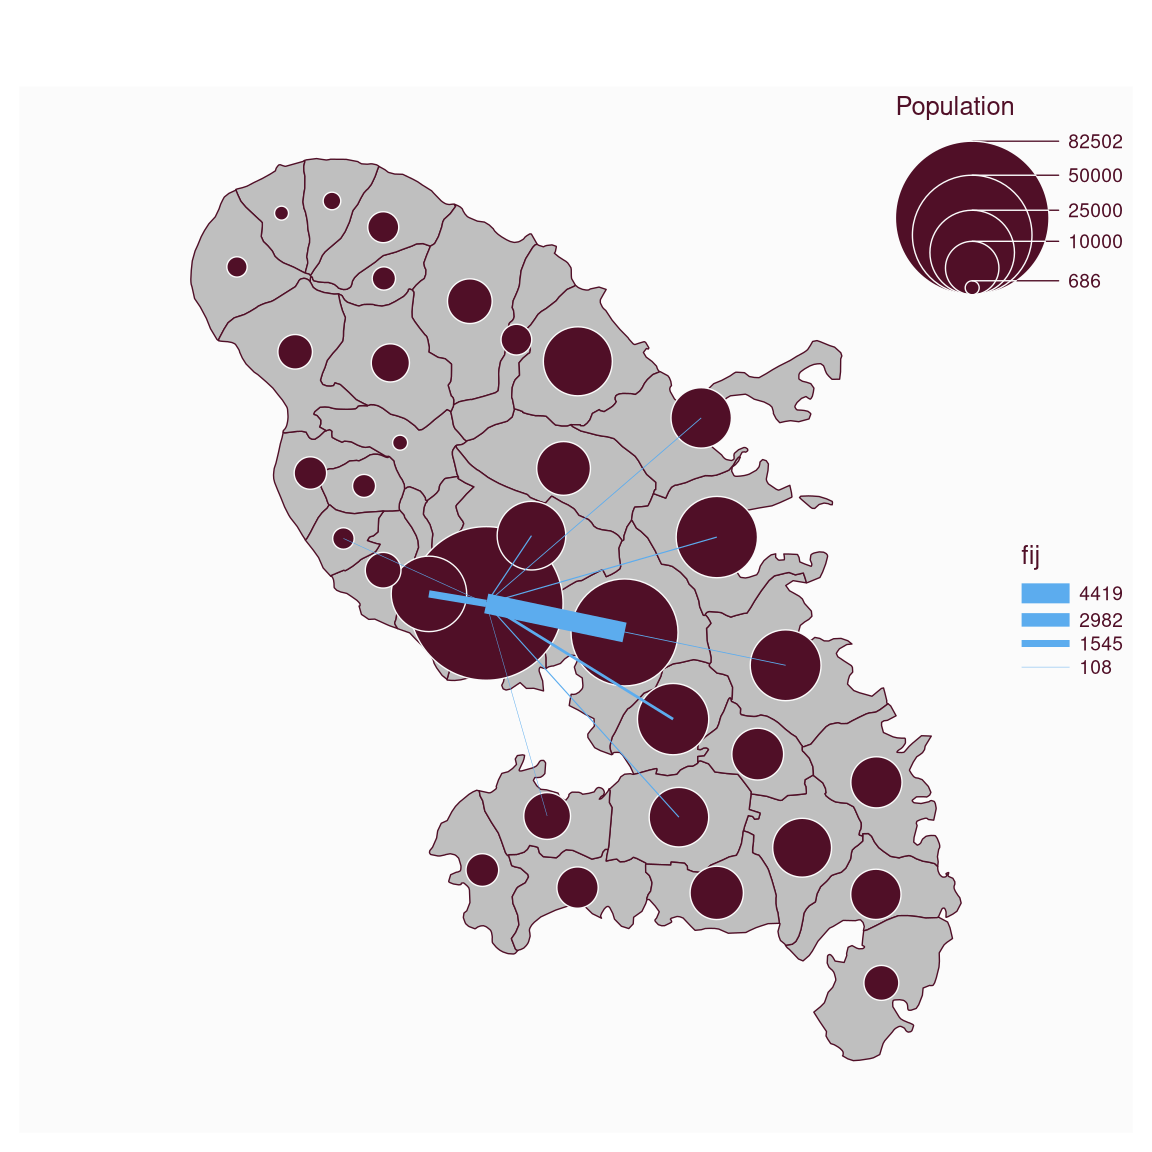
mf_map(mtq, "POP", "prop",
inches = .4, leg_title = "Population",
leg_pos = "topright"
)
mf_map(flows, "fij", "prop",
lwd_max = 10, col = "steelblue2",
leg_pos = "right"
)