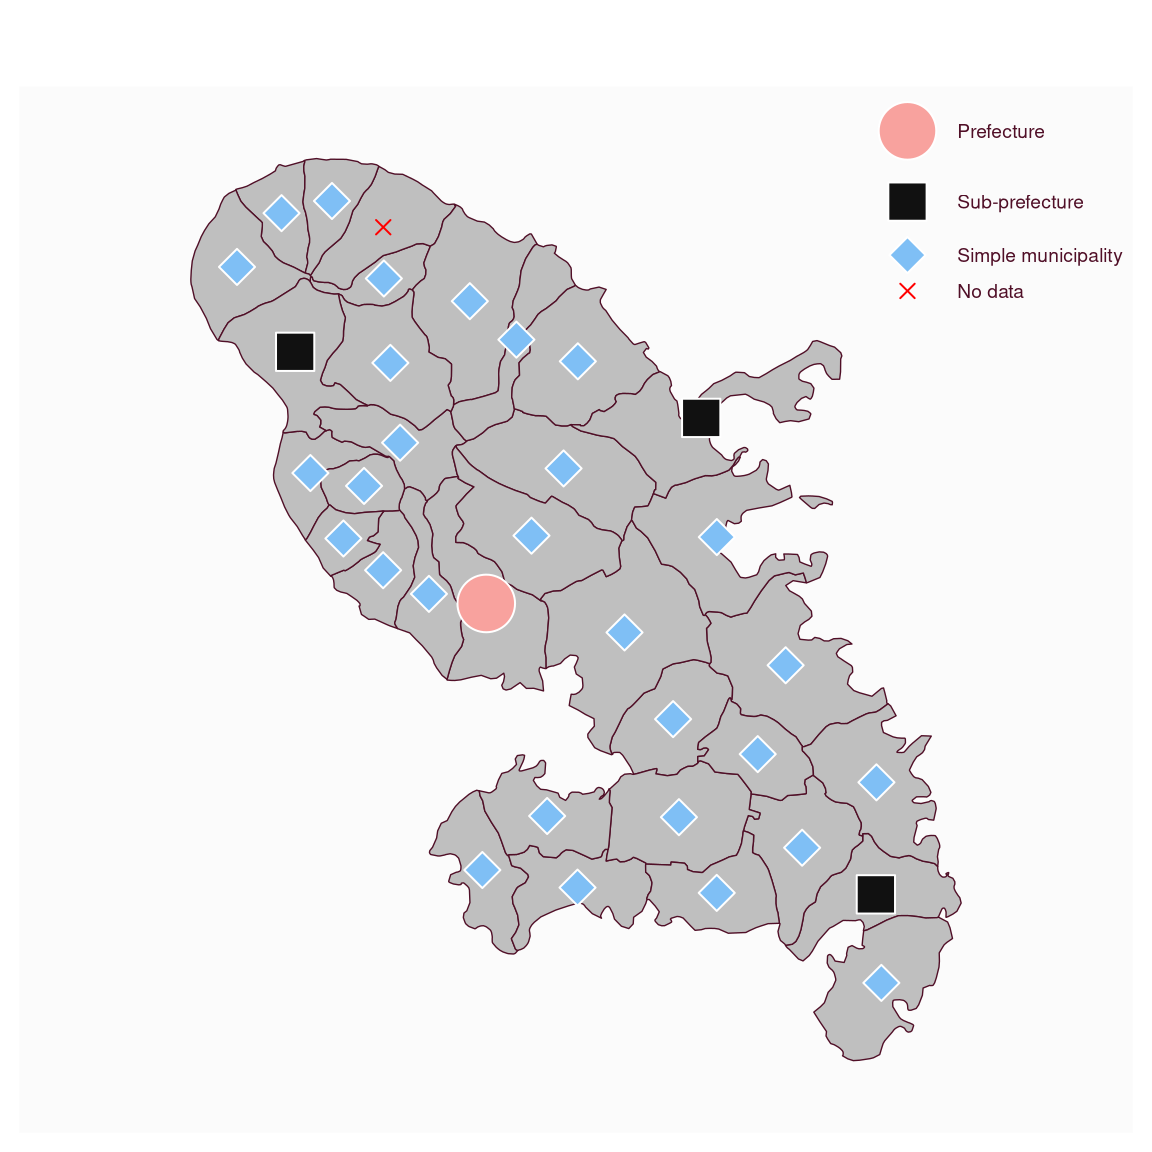
mf_map() can use symbols to display qualitative data, using symb
map type.
For polygons, centroids are used to plot graduated symbols. This map type is not available for lines.
Arguments
- x
object of class
sf(polygons or points)- var
name of the variable to map
- type
"symb"
- pch
a vector of types of symbols, see pch. The length of
pchshould match the number of modalities.- cex
a vector of sizes for symbols. The length of
cexshould match the number of modalities.- lwd
border width of symbols
- pal
a set of colors (hex codes) or a palette name. Palette names can be obtained with hcl.pals. The default palette is the pal_quali palette (see mf_theme).
- rev
if
palis a palette name, whether the ordering of the colors should be reversed (TRUE) or not (FALSE)- border
border color for symbols, a hex code or color name given by colors. The default color is the background color (see mf_theme).
- val_order
modalities order in the legend, a character vector that matches
varmodalities. Default to alphabetic order of modalities.- pch_na
type of symbol for missing values, see pch
- cex_na
size of symbol for missing values
- col_na
color for missing values, a hex code or a color name given by colors