This function is deprecated. Please use mf_map() with type = "prop"
instead.
Plot proportional symbols.
Usage
mf_prop(
  x,
  var,
  inches = 0.3,
  val_max,
  lwd_max = 20,
  symbol = "circle",
  col,
  alpha = NULL,
  border,
  lwd = 0.7,
  extent = x,
  bg,
  expandBB = rep(0.04, 4),
  leg_pos = mf_get_leg_pos(x),
  leg_title = var,
  leg_title_cex = 0.8,
  leg_val_cex = 0.6,
  leg_val_rnd = 0,
  leg_val_dec = ".",
  leg_val_big = "",
  leg_frame = FALSE,
  leg_frame_border,
  leg_horiz = FALSE,
  leg_adj = c(0, 0),
  leg_fg,
  leg_bg,
  leg_size = 1,
  add = TRUE
)
Arguments
- x
object of class
sf- var
name(s) of the variable(s) to plot
- inches
size of the biggest symbol (radius for circles, half width for squares) in inches.
- val_max
maximum value used for proportional symbols
- lwd_max
line width of the largest line
- symbol
type of symbols, 'circle' or 'square'
- col
a color, hex code or color name given by
colors- alpha
opacity, in the range 0,1
- border
border color
- lwd
border width
- leg_pos
position of the legend, one of 'topleft', 'top','topright', 'right', 'bottomright', 'bottom', 'bottomleft', 'left' or a vector of two coordinates in map units (c(x, y)). Use
NAto avoid plotting the legend, use 'interactive' to choose the legend position by clicking on the map.- leg_title
legend title
- leg_title_cex
size of the legend title
- leg_val_cex
size of the values in the legend
- leg_val_rnd
number of decimal places of the values in the legend
- leg_val_dec
decimal separator
- leg_val_big
thousands separator
- leg_frame
whether to add a frame to the legend (TRUE) or not (FALSE)
- leg_frame_border
border color of the legend frame
- leg_horiz
display the legend horizontally (for proportional symbols and choropleth types)
- leg_adj
adjust the position of the legend in x and y directions
- leg_fg
color of the legend foreground
- leg_bg
color of the legend background
- leg_size
size of the legend; 2 means two times bigger
- add
whether to add the layer to an existing plot (TRUE) or not (FALSE)
Examples
mtq <- mf_get_mtq()
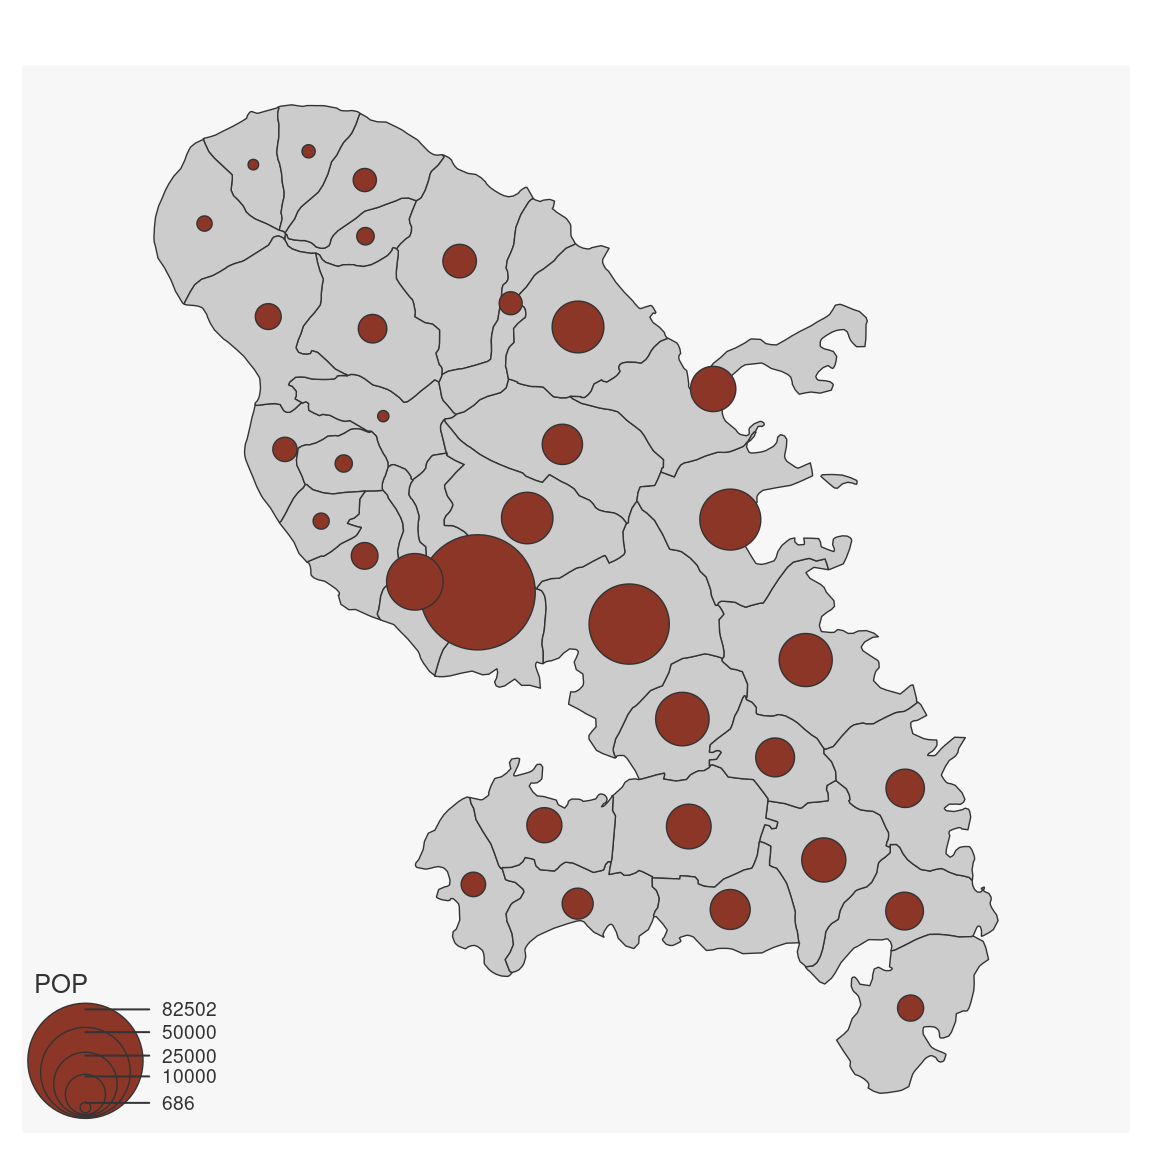
mf_map(mtq)
mf_map(mtq, "POP", "prop")
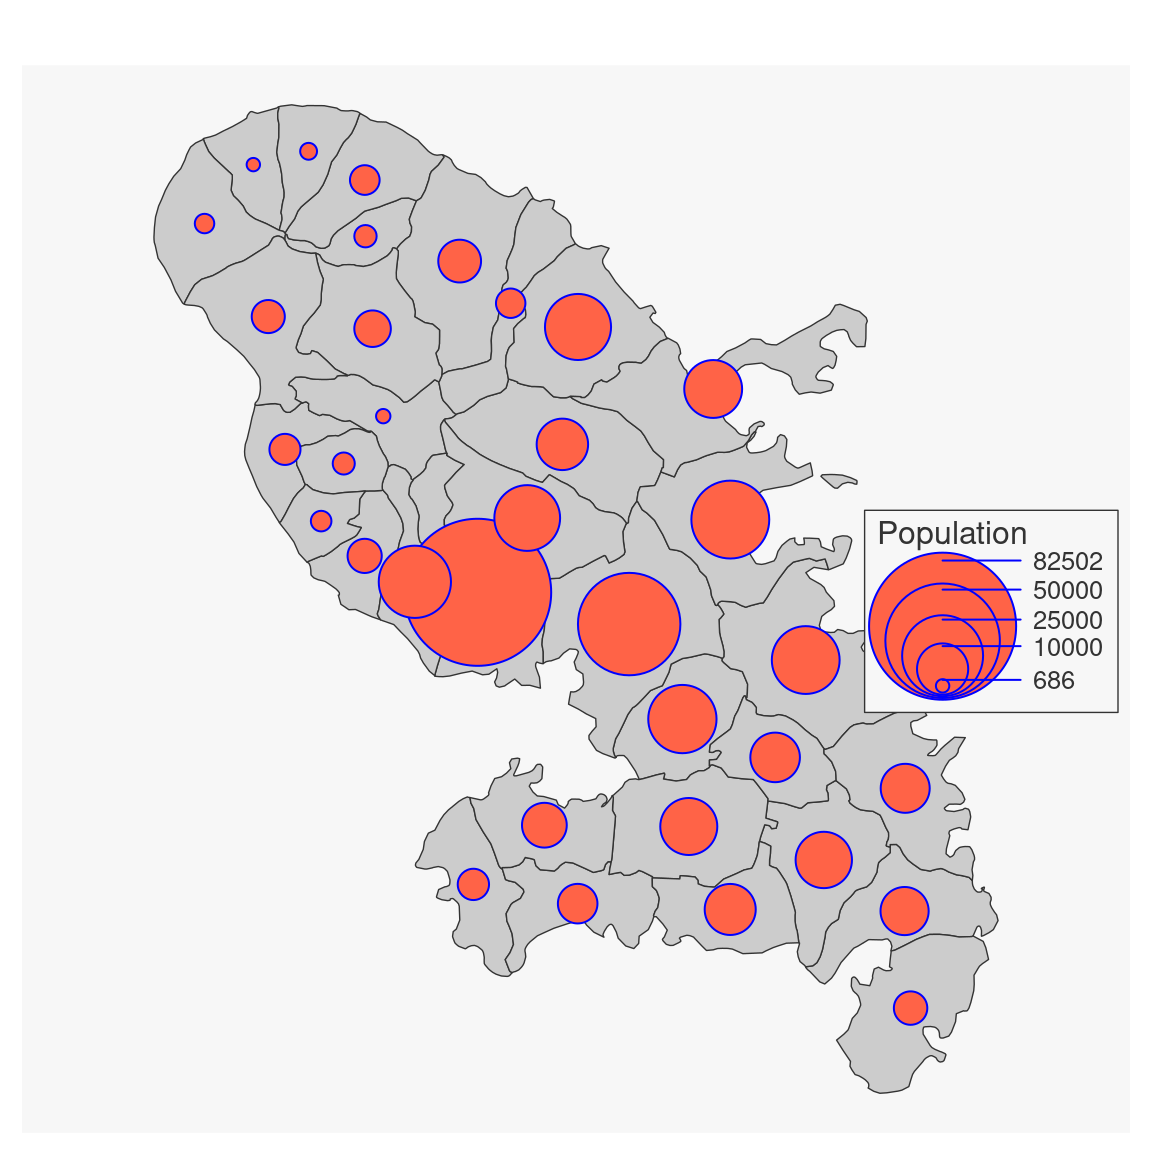
 mf_map(mtq)
mf_map(
x = mtq, var = "POP", type = "prop",
inches = .4, symbol = "circle", val_max = 90000,
col = "tomato1", border = "blue", lwd = 1,
leg_pos = "right", leg_title = "Population",
leg_title_cex = 1, leg_val_cex = .8, leg_val_rnd = 0,
leg_frame = TRUE, add = TRUE
)
mf_map(mtq)
mf_map(
x = mtq, var = "POP", type = "prop",
inches = .4, symbol = "circle", val_max = 90000,
col = "tomato1", border = "blue", lwd = 1,
leg_pos = "right", leg_title = "Population",
leg_title_cex = 1, leg_val_cex = .8, leg_val_rnd = 0,
leg_frame = TRUE, add = TRUE
)