Deprecated - Plot proportional symbols using choropleth coloration
Source:R/mf_prop_choro.R
mf_prop_choro.RdThis function is deprecated. Please use mf_map() with type = "prop_choro"
instead.
Plot proportional symbols with colors based on a quantitative data classification.
Usage
mf_prop_choro(
  x,
  var,
  inches = 0.3,
  val_max,
  symbol = "circle",
  pal,
  alpha = NULL,
  rev = FALSE,
  breaks = "quantile",
  nbreaks,
  border,
  lwd = 0.7,
  col_na = "white",
  extent = x,
  bg,
  expandBB = rep(0.04, 4),
  leg_pos = mf_get_leg_pos(x, 1),
  leg_title = var,
  leg_title_cex = c(0.8, 0.8),
  leg_val_cex = c(0.6, 0.6),
  leg_val_rnd = c(0, 2),
  leg_val_dec = ".",
  leg_val_big = "",
  leg_no_data = "No data",
  leg_frame = c(FALSE, FALSE),
  leg_frame_border,
  leg_horiz = c(FALSE, FALSE),
  leg_adj = c(0, 0),
  leg_fg,
  leg_bg,
  leg_size = 1,
  leg_box_border,
  leg_box_cex = c(1, 1),
  add = TRUE
)
Arguments
- x
object of class
sf- var
name(s) of the variable(s) to plot
- inches
size of the biggest symbol (radius for circles, half width for squares) in inches.
- val_max
maximum value used for proportional symbols
- symbol
type of symbols, 'circle' or 'square'
- pal
a set of colors (hex codes) or a palette name (valid palette names can be obtained with
hcl.pals).- alpha
opacity, in the range 0,1
- rev
if
palis a valid palette name, whether the ordering of the colors should be reversed (TRUE) or not (FALSE)- breaks
either a numeric vector with the actual breaks, or a classification method name (see mf_get_breaks and Details)
- nbreaks
number of classes
- border
border color
- lwd
border width
- col_na
color for missing values
- leg_pos
position of the legend, two of 'topleft', 'top','topright', 'right','bottomright', 'bottom', 'bottomleft', 'left' or a vector of two coordinates in map units (c(x, y)). leg_pos argument can be c('position', 'position'), c('position', x2, y2), c(x1,y1, 'position') or c(x1, y1, x2, y2). Use
NAto avoid plotting the legend, use 'interactive' to choose the legend position by clicking on the map.- leg_title
legend title
- leg_title_cex
size of the legend title
- leg_val_cex
size of the values in the legend
- leg_val_rnd
number of decimal places of the values in the legend
- leg_val_dec
decimal separator
- leg_val_big
thousands separator
- leg_no_data
label for missing values
- leg_frame
whether to add a frame to the legend (TRUE) or not (FALSE)
- leg_frame_border
border color of the legend frame
- leg_horiz
display the legend horizontally (for proportional symbols and choropleth types)
- leg_adj
adjust the position of the legend in x and y directions
- leg_fg
color of the legend foreground
- leg_bg
color of the legend background
- leg_size
size of the legend; 2 means two times bigger
- leg_box_border
border color of legend boxes
- leg_box_cex
width and height size expansion of boxes
- add
whether to add the layer to an existing plot (TRUE) or not (FALSE)
Details
Breaks defined by a numeric vector or a classification method are
left-closed: breaks defined by c(2, 5, 10, 15, 20)
will be mapped as [2 - 5[, [5 - 10[, [10 - 15[, [15 - 20].
The "jenks" method is an exception and has to be right-closed.
Jenks breaks computed as c(2, 5, 10, 15, 20)
will be mapped as [2 - 5], ]5 - 10], ]10 - 15], ]15 - 20].
Examples
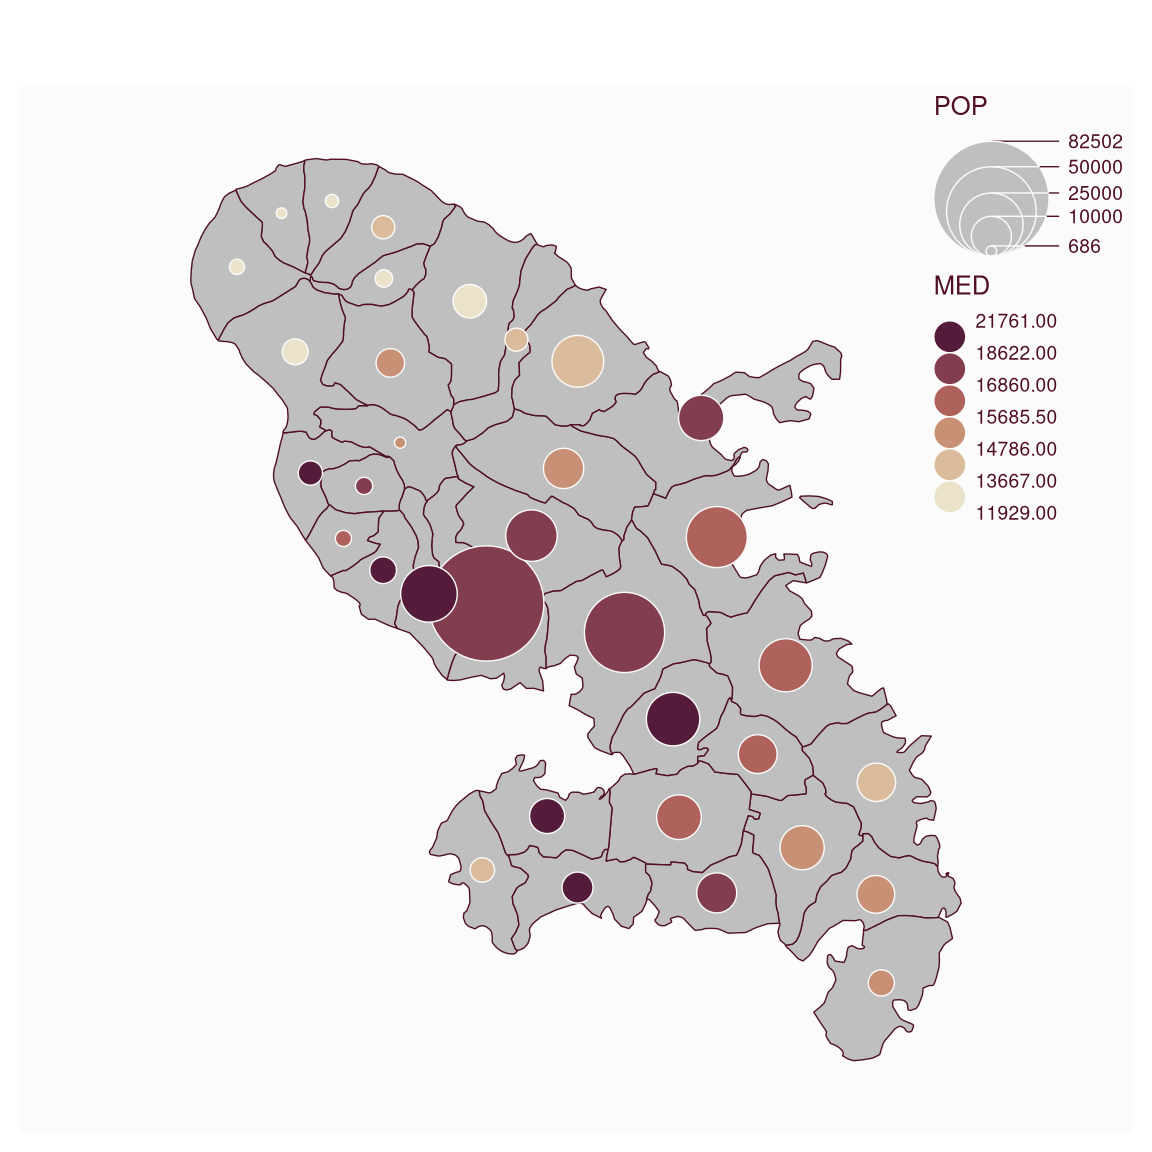
mtq <- mf_get_mtq()
mf_map(mtq)
mf_map(mtq, c("POP", "MED"), "prop_choro")
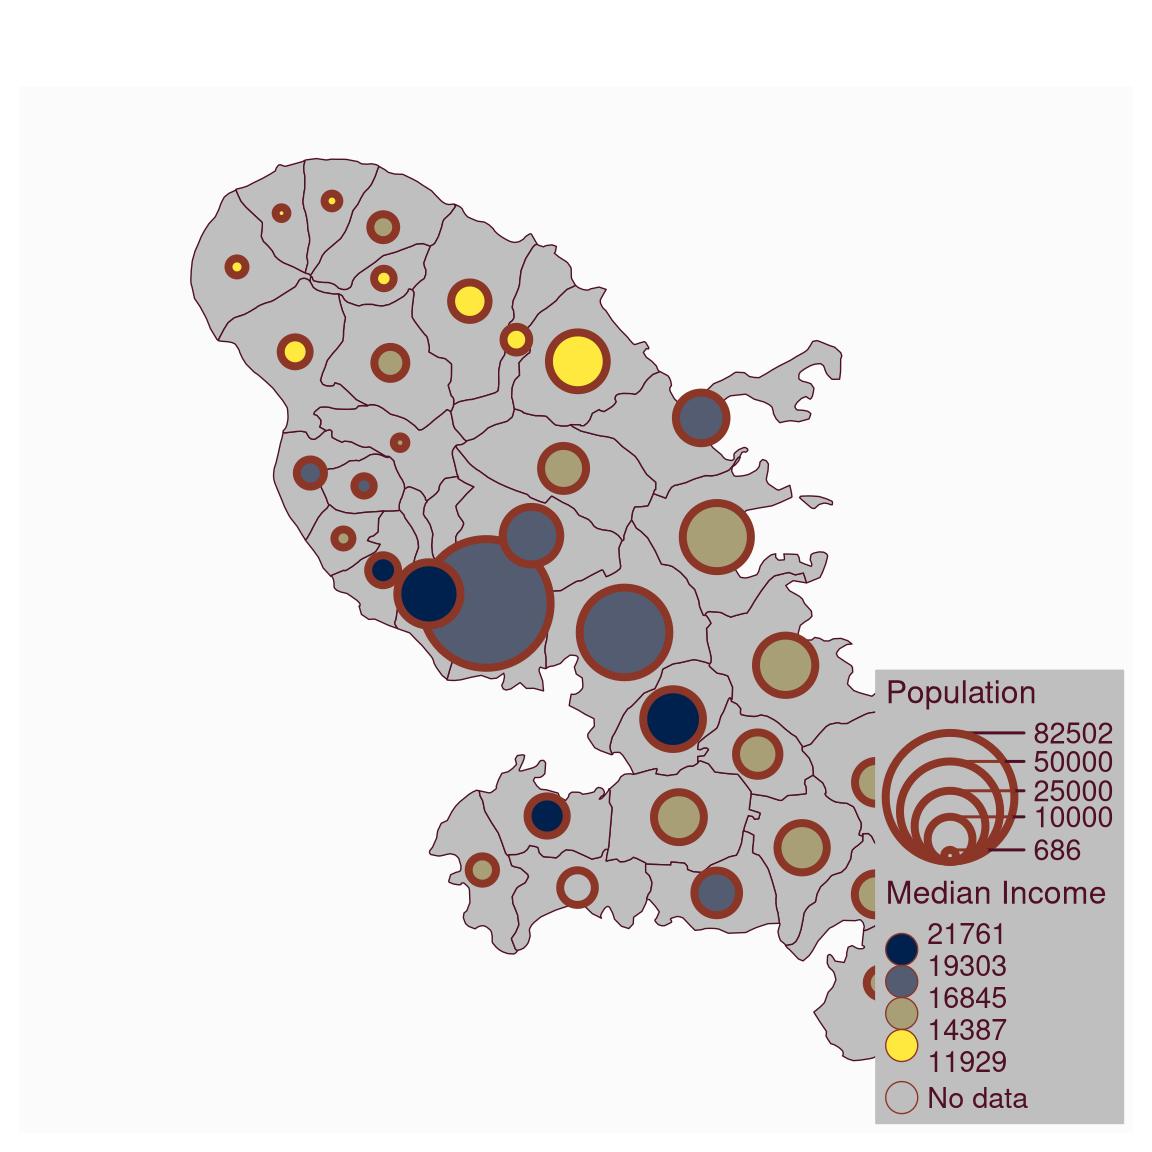
 mf_map(mtq)
mtq[6, "MED"] <- NA
mf_map(
x = mtq, var = c("POP", "MED"), type = "prop_choro",
inches = .35, border = "tomato4",
val_max = 90000, symbol = "circle", col_na = "grey", pal = "Cividis",
breaks = "equal", nbreaks = 4, lwd = 4,
leg_pos = "bottomright",
leg_title = c("Population", "Median Income"),
leg_title_cex = 1,
leg_val_cex = .9,
leg_val_rnd = c(0, 0),
leg_no_data = "No data",
leg_frame = TRUE,
add = TRUE
)
mf_map(mtq)
mtq[6, "MED"] <- NA
mf_map(
x = mtq, var = c("POP", "MED"), type = "prop_choro",
inches = .35, border = "tomato4",
val_max = 90000, symbol = "circle", col_na = "grey", pal = "Cividis",
breaks = "equal", nbreaks = 4, lwd = 4,
leg_pos = "bottomright",
leg_title = c("Population", "Median Income"),
leg_title_cex = 1,
leg_val_cex = .9,
leg_val_rnd = c(0, 0),
leg_no_data = "No data",
leg_frame = TRUE,
add = TRUE
)