Plot a raster object (SpatRaster from terra).
Usage
mf_raster(
  x,
  type,
  nbreaks,
  breaks = "equal",
  val_order,
  pal,
  alpha = NULL,
  rev = FALSE,
  expandBB = rep(0, 4),
  bg,
  leg_pos = "right",
  leg_title = names(x),
  leg_title_cex = 0.8,
  leg_val_cex = 0.6,
  leg_val_rnd = 1,
  leg_val_dec = ".",
  leg_val_big = "",
  leg_frame = FALSE,
  leg_frame_border,
  leg_horiz = FALSE,
  leg_adj = c(0, 0),
  leg_box_border,
  leg_box_cex = c(1, 1),
  leg_fg,
  leg_bg,
  leg_size = 1,
  add = FALSE,
  ...
)
Arguments
- x
a
SpatRaster- type
type of raster map, one of "continuous", "classes", or "interval". Default type for a numeric and categorial raster are "continuous" and "classes" respectively.
- nbreaks
number of classes (for type = "interval" only)
- breaks
either a numeric vector with the actual breaks (for type = "continuous" and type = "interval"), or a classification method name (for type = "interval" only; see mf_get_breaks for details).
- val_order
modalities order in the legend, a character vector that matches
varmodalities. Default to alphabetic order of modalities (for type = "classes" only).- pal
a set of colors (hex codes) or a palette name. Palette names can be obtained with hcl.pals. The default palette is the pal_quali palette for type = "classes" and pal_seq otherwise (see mf_theme).
- alpha
pal` opacity, in the range [0,1] (0 means transparent and 1 means opaque). Default is set to 1.
- rev
if
palis a palette name, whether the ordering of the colors should be reversed (TRUE) or not (FALSE)- expandBB
expension of the map area in each direction (bottom, left, top, right). The expension is expressed as a share of
xwidth (for left and right values) or a share ofxheight (for bottom and top values).- bg
background color of the map, hex code or color name given by colors, ignored if
add = TRUE- leg_pos
position of the legend, one of 'topleft', 'top','topright', 'right', 'bottomright', 'bottom', 'bottomleft', 'left' or a vector of two coordinates in map units (c(x, y)). Use
NAto avoid plotting the legend, use 'interactive' to choose the legend position by clicking on the map.- leg_title
legend title
- leg_title_cex
size of the title
- leg_val_cex
size of the values
- leg_val_rnd
number of decimal places of the values displayed in the legend
- leg_val_dec
decimal separator
- leg_val_big
thousands separator
- leg_frame
whether to add a frame to the legend (TRUE) or not (FALSE)
- leg_frame_border
border color of the legend frame
- leg_horiz
display the legend horizontally (for proportional symbols and choropleth types)
- leg_adj
adjust the position of the legend in x and y directions
- leg_box_border
border color of legend boxes (for types related to choropleth and typology)
- leg_box_cex
width and height size expansion of boxes
- leg_fg
color of the legend foreground
- leg_bg
color of the legend background
- leg_size
size of the legend. Combine this argument with
leg_title_cexandleg_val_cex.- add
whether to add the layer to an existing plot (TRUE) or not (FALSE)
- ...
bgalpha, smooth, maxcell or other arguments passed to
terra::plotRGBorterra::plot
Examples
if (require("terra")) {
# multi band
logo <- rast(system.file("ex/logo.tif", package = "terra"))
mf_raster(logo)
# one band
elev <- rast(system.file("ex/elev.tif", package = "terra"))
## continuous
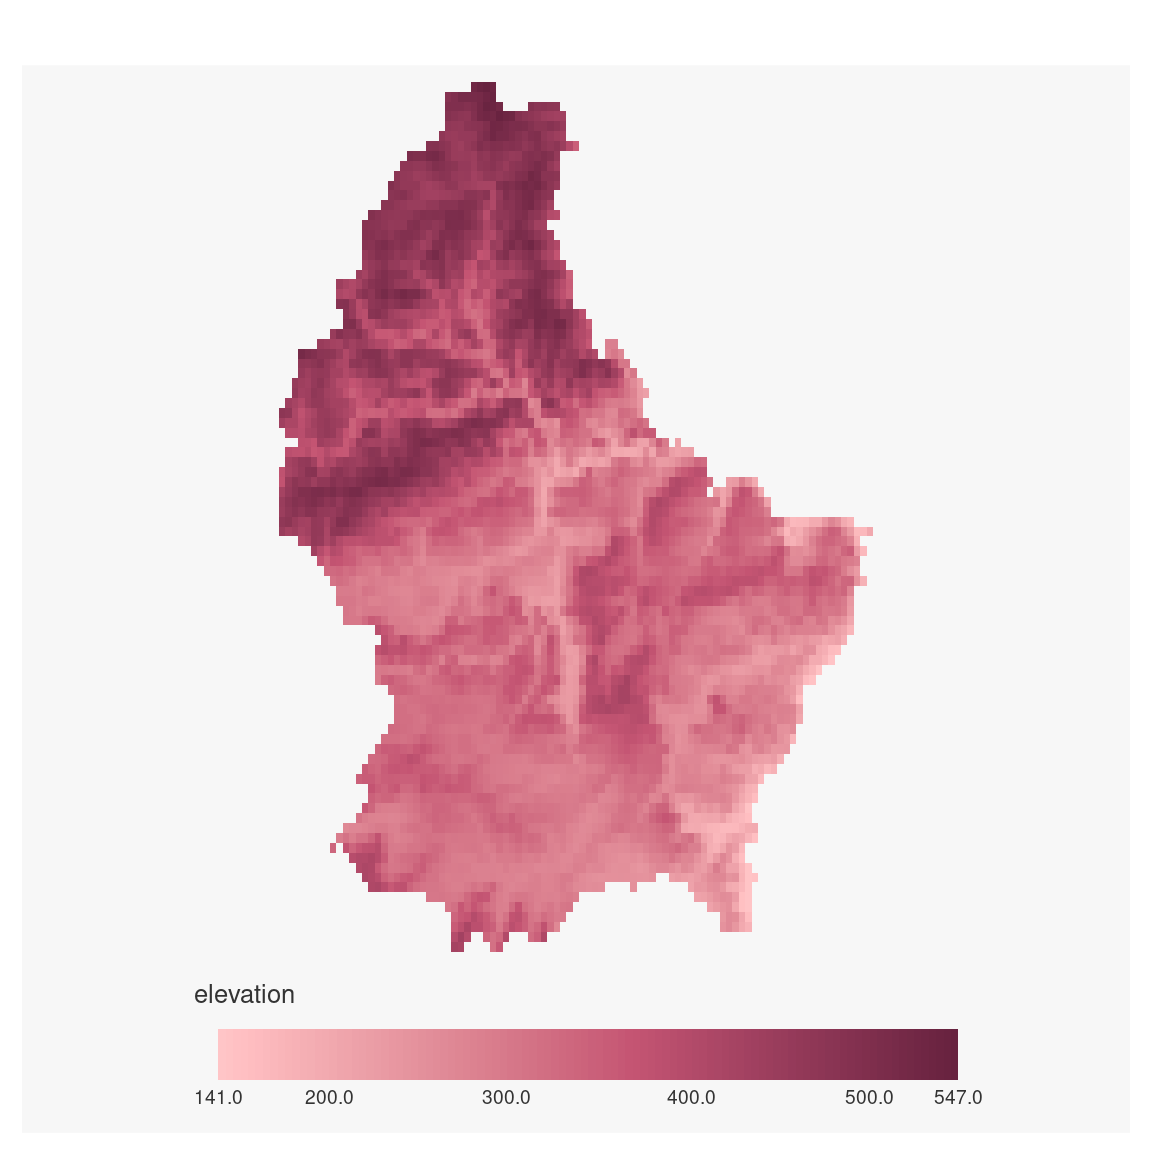
mf_raster(elev)
mf_raster(elev,
pal = "Burg", expandBB = c(.2, 0, 0, 0),
leg_pos = "bottom", leg_horiz = TRUE
)
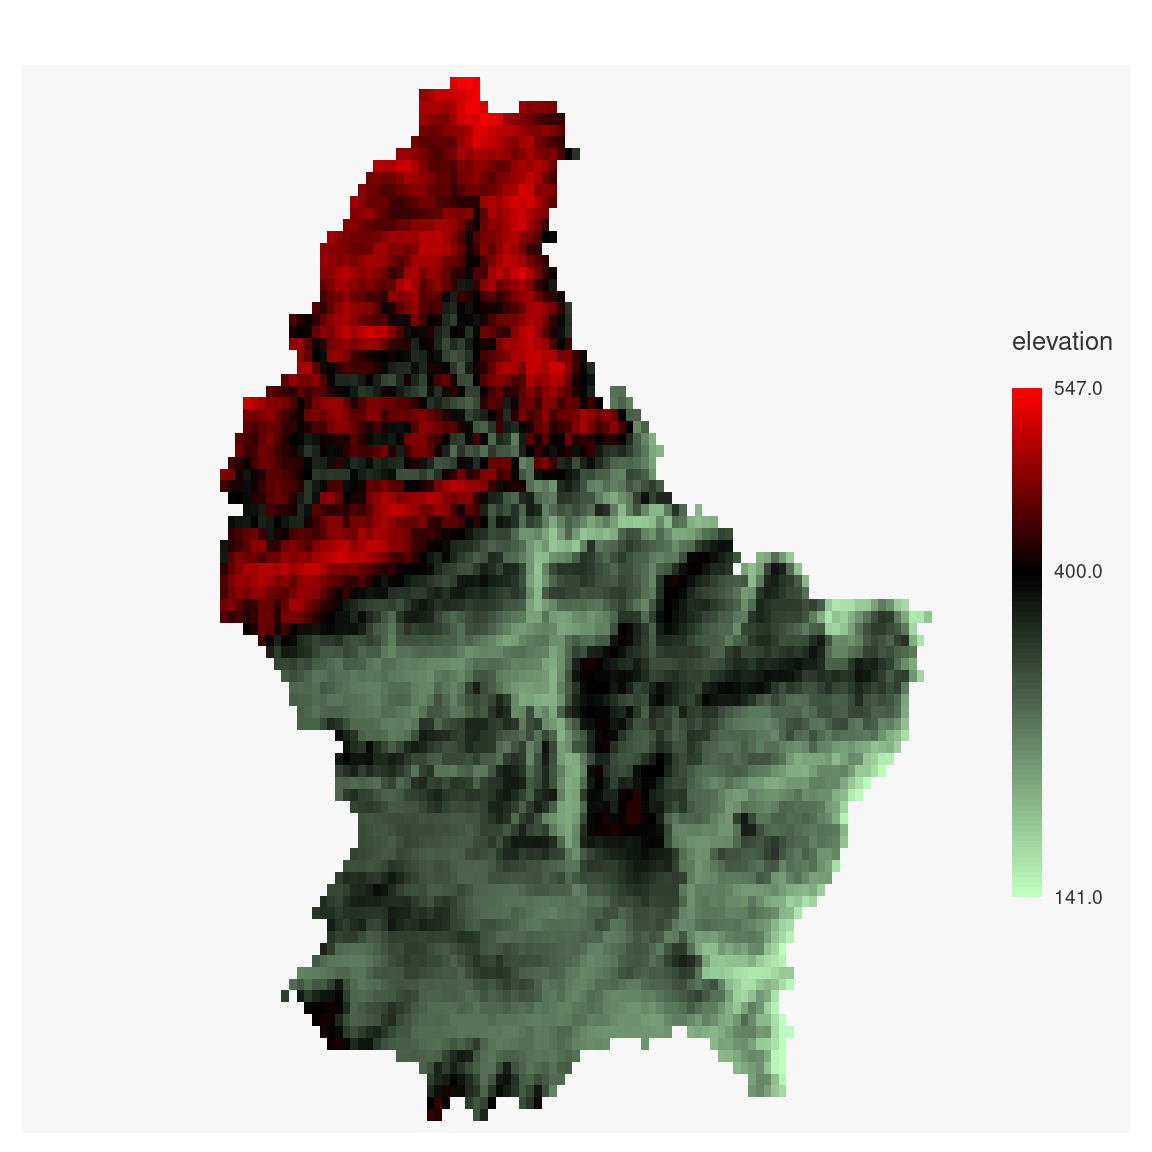
## continuous with colors and breaks
mf_raster(elev,
type = "continuous",
breaks = c(141, 400, 547),
pal = c("darkseagreen1", "black", "red")
)
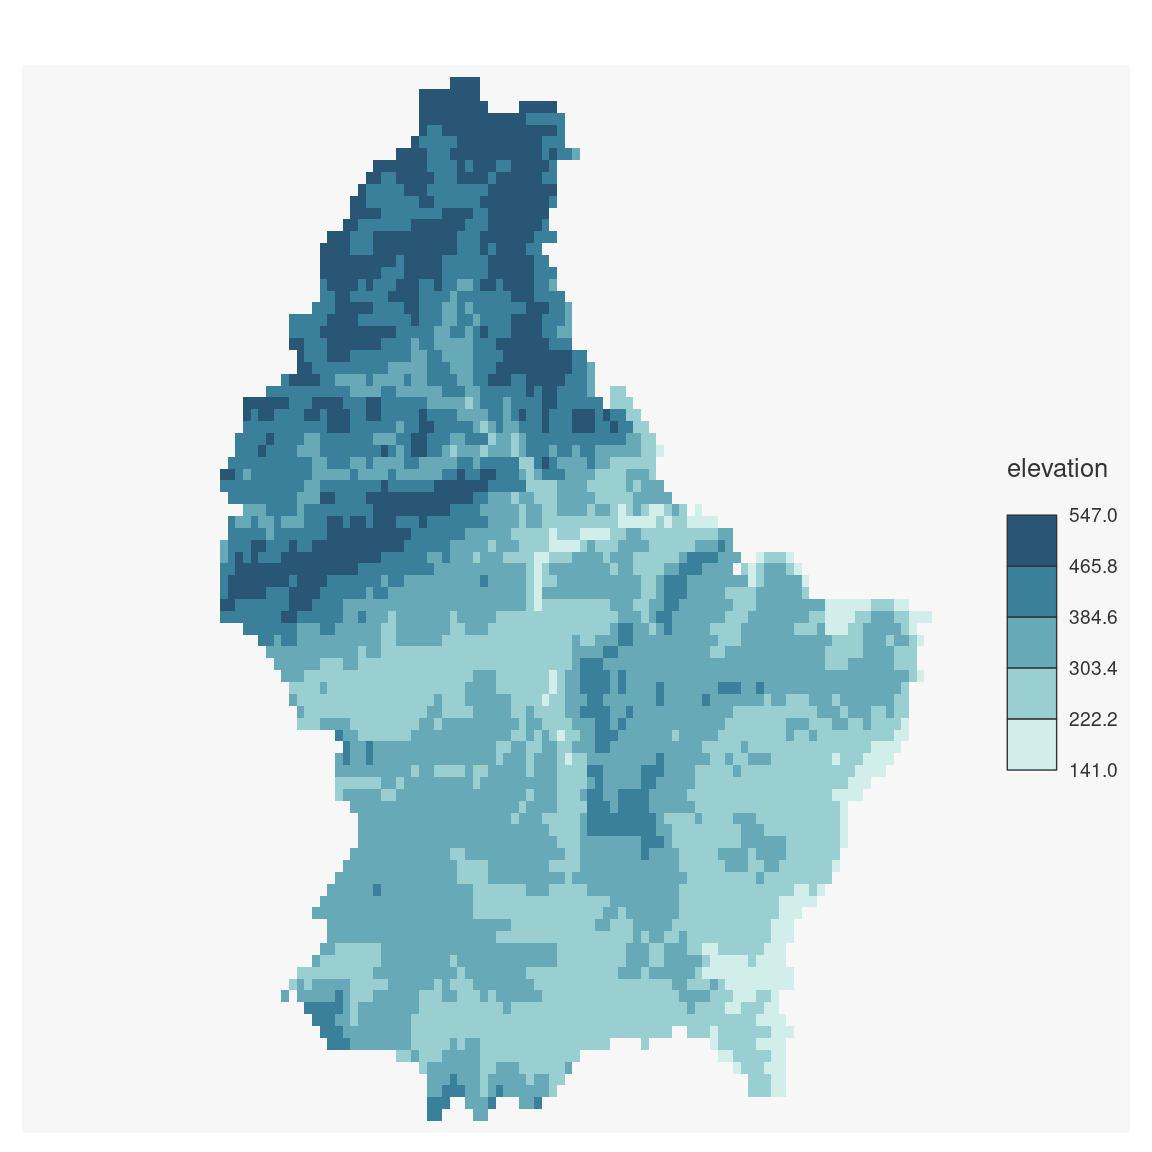
## interval
mf_raster(elev,
type = "interval",
nbreaks = 5, breaks = "equal", pal = "Teal"
)
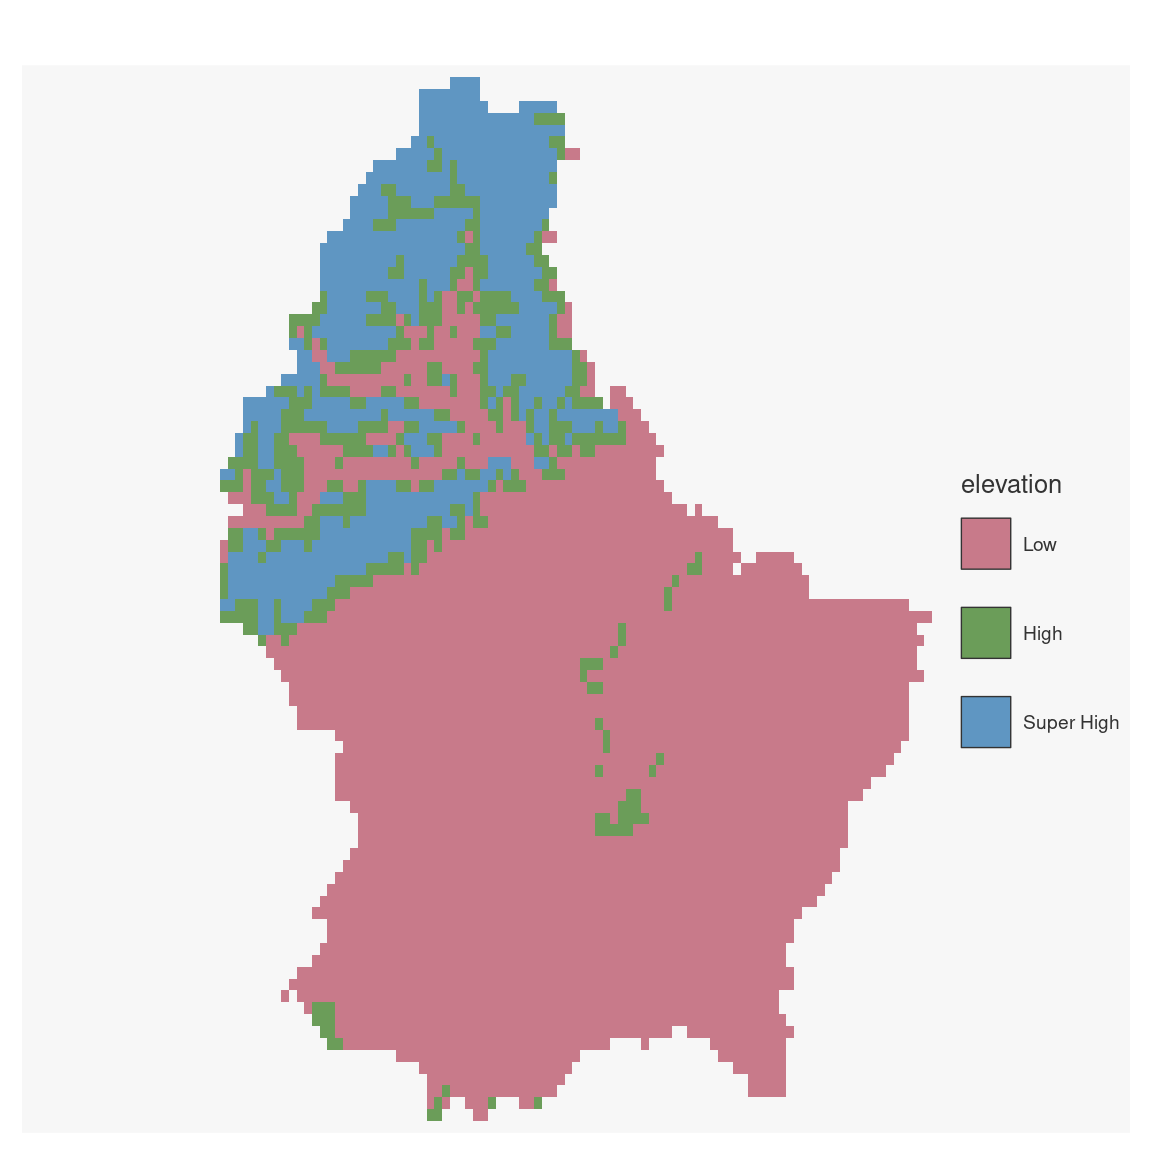
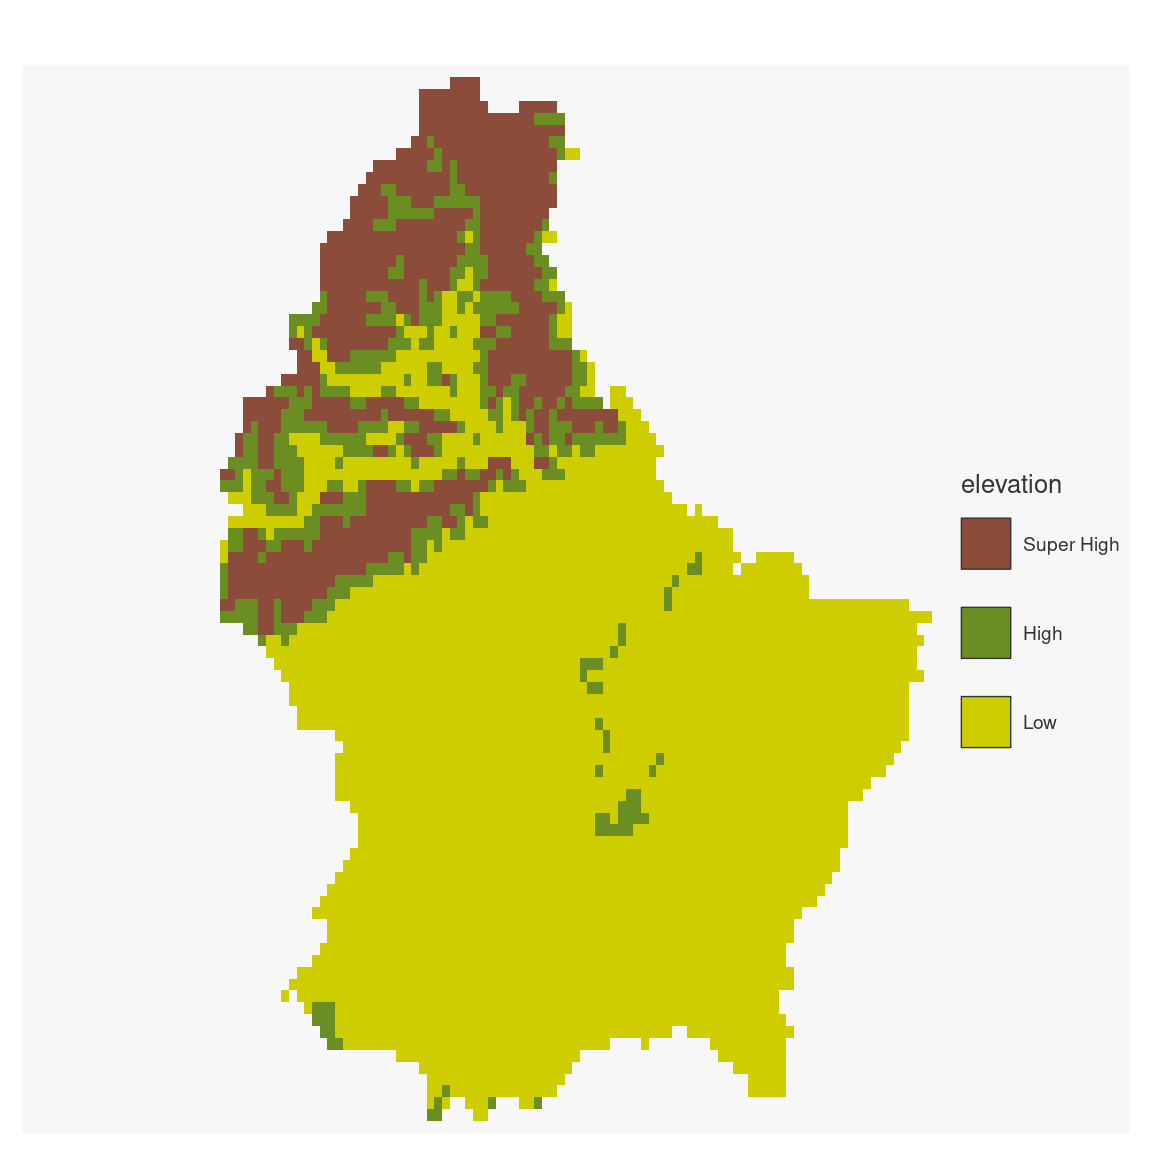
## classes
elev2 <- classify(elev, c(140, 400, 450, 549))
lev_evel <- data.frame(ID = 0:2, elevation = c("Low", "High", "Super High"))
levels(elev2) <- lev_evel
mf_raster(elev2)
mf_raster(elev2,
pal = c("salmon4", "olivedrab", "yellow3"),
val_order = c("Super High", "High", "Low")
)
}
#> Loading required package: terra
#> terra 1.9.27