Plot a point on a world map.
Usage
mf_worldmap(
  x,
  lon,
  lat,
  water_col = "lightblue",
  land_col = "grey60",
  border_col = "grey40",
  border_lwd = 0.8,
  ...
)
Arguments
- x
object of class
sforsfc- lon
longitude
- lat
latitude
- water_col
color of the water, hex code or color name given by colors
- land_col
color of the land, hex code or color name given by colors
- border_col
color of the borders, hex code or color name given by colors
- border_lwd
width of the borders, hex code or color name given by colors
- ...
further parameters related to the plotted point aspect (cex, pch, col...)
Examples
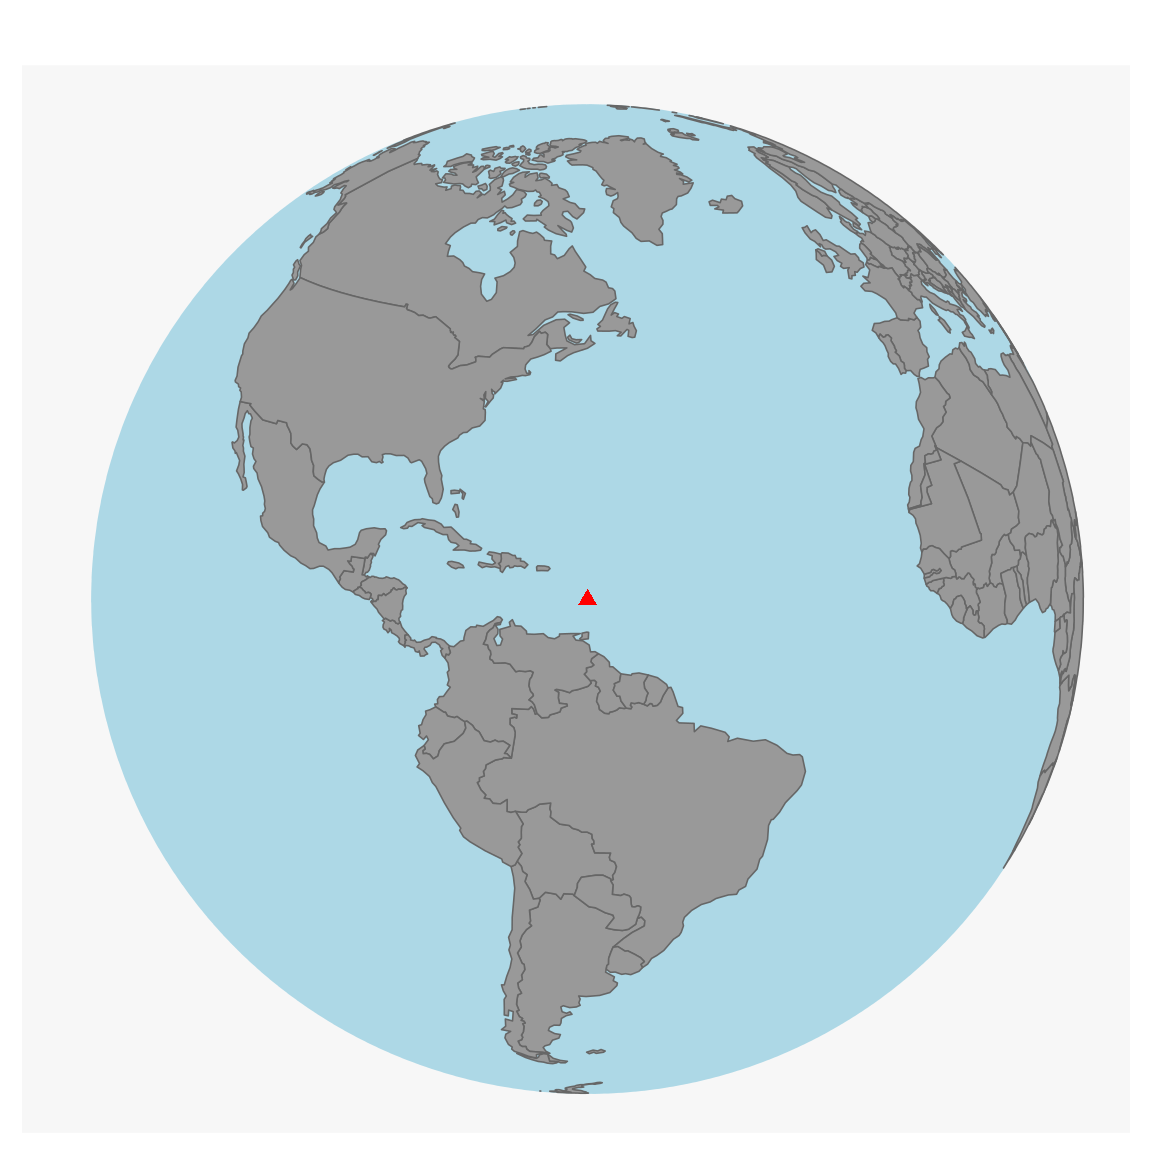
mtq <- mf_get_mtq()
mf_worldmap(mtq)
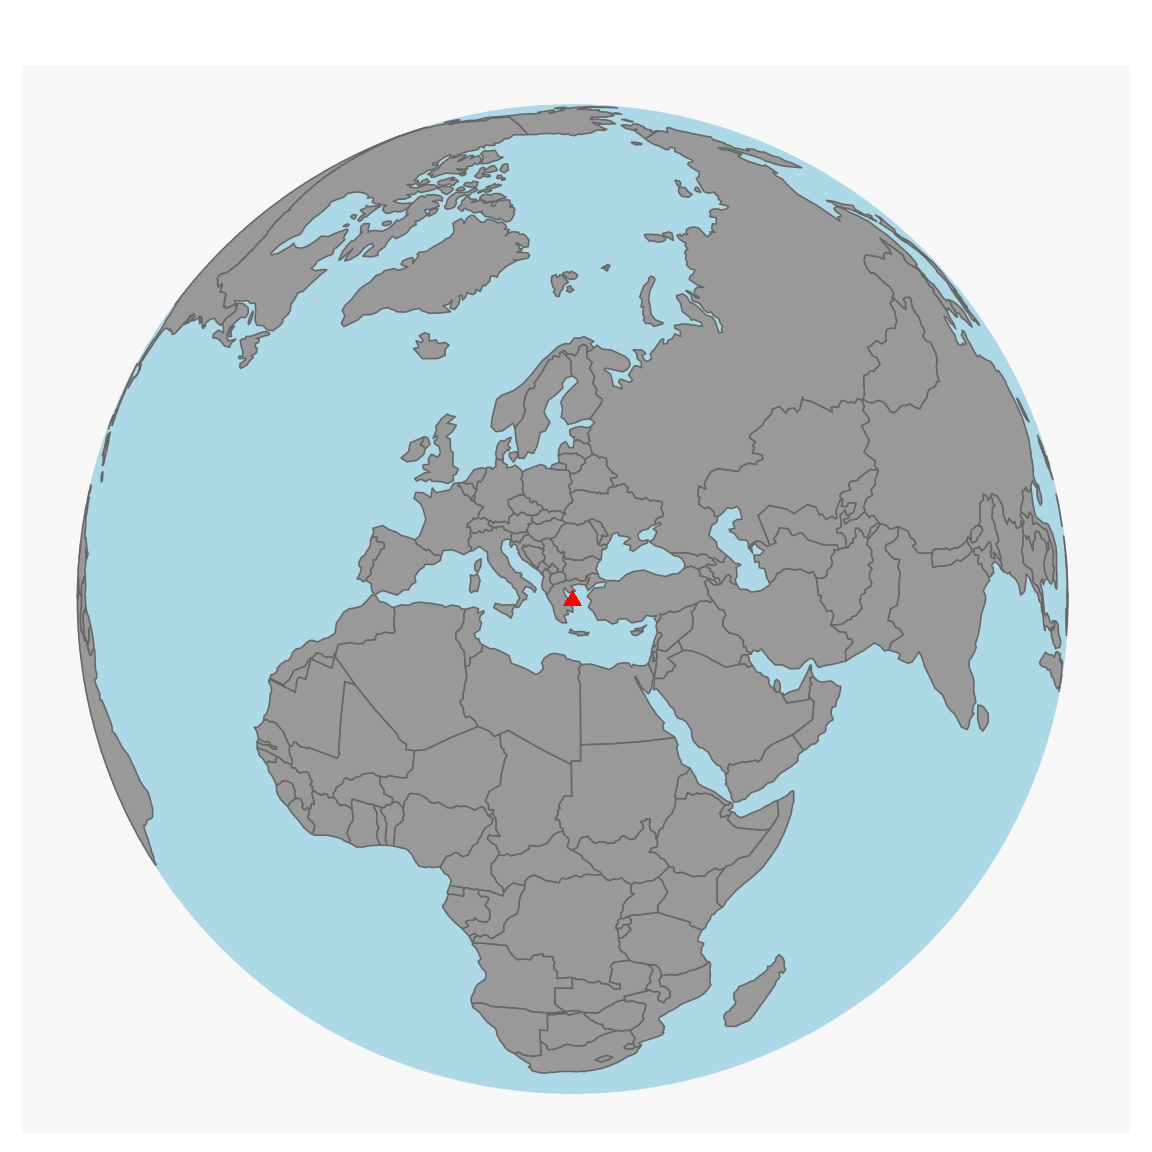
 mf_worldmap(lon = 24, lat = 39)
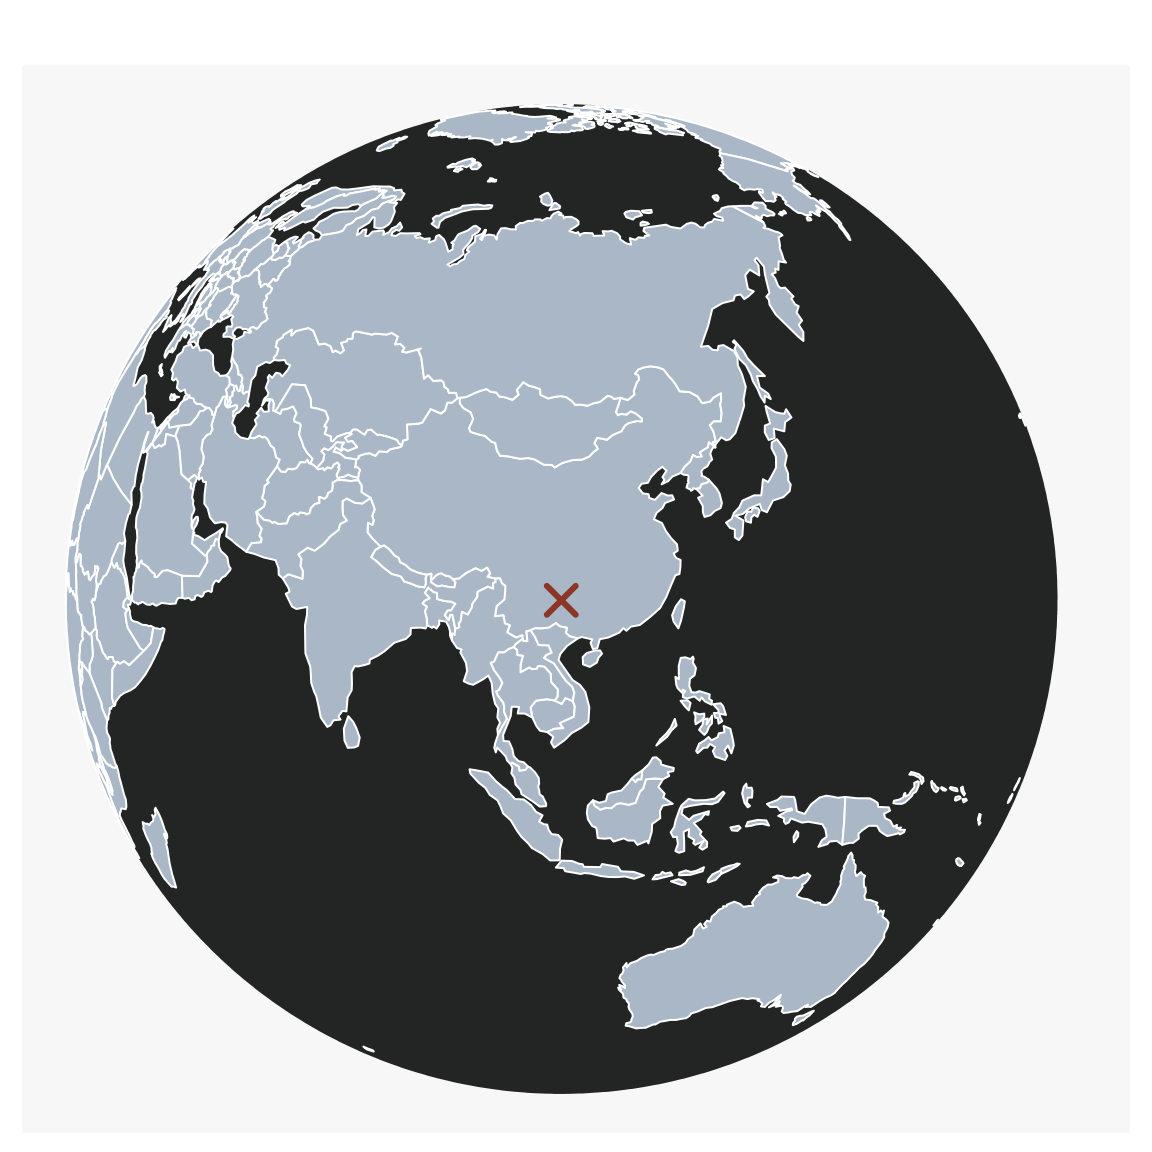
 mf_worldmap(
lon = 106, lat = 26,
pch = 4, lwd = 3, cex = 2, col = "tomato4",
water_col = "#232525", land_col = "#A9B7C6",
border_col = "white", border_lwd = 1
)
mf_worldmap(
lon = 106, lat = 26,
pch = 4, lwd = 3, cex = 2, col = "tomato4",
water_col = "#232525", land_col = "#A9B7C6",
border_col = "white", border_lwd = 1
)