Tricolore - v0.1.0
Tricolore.js


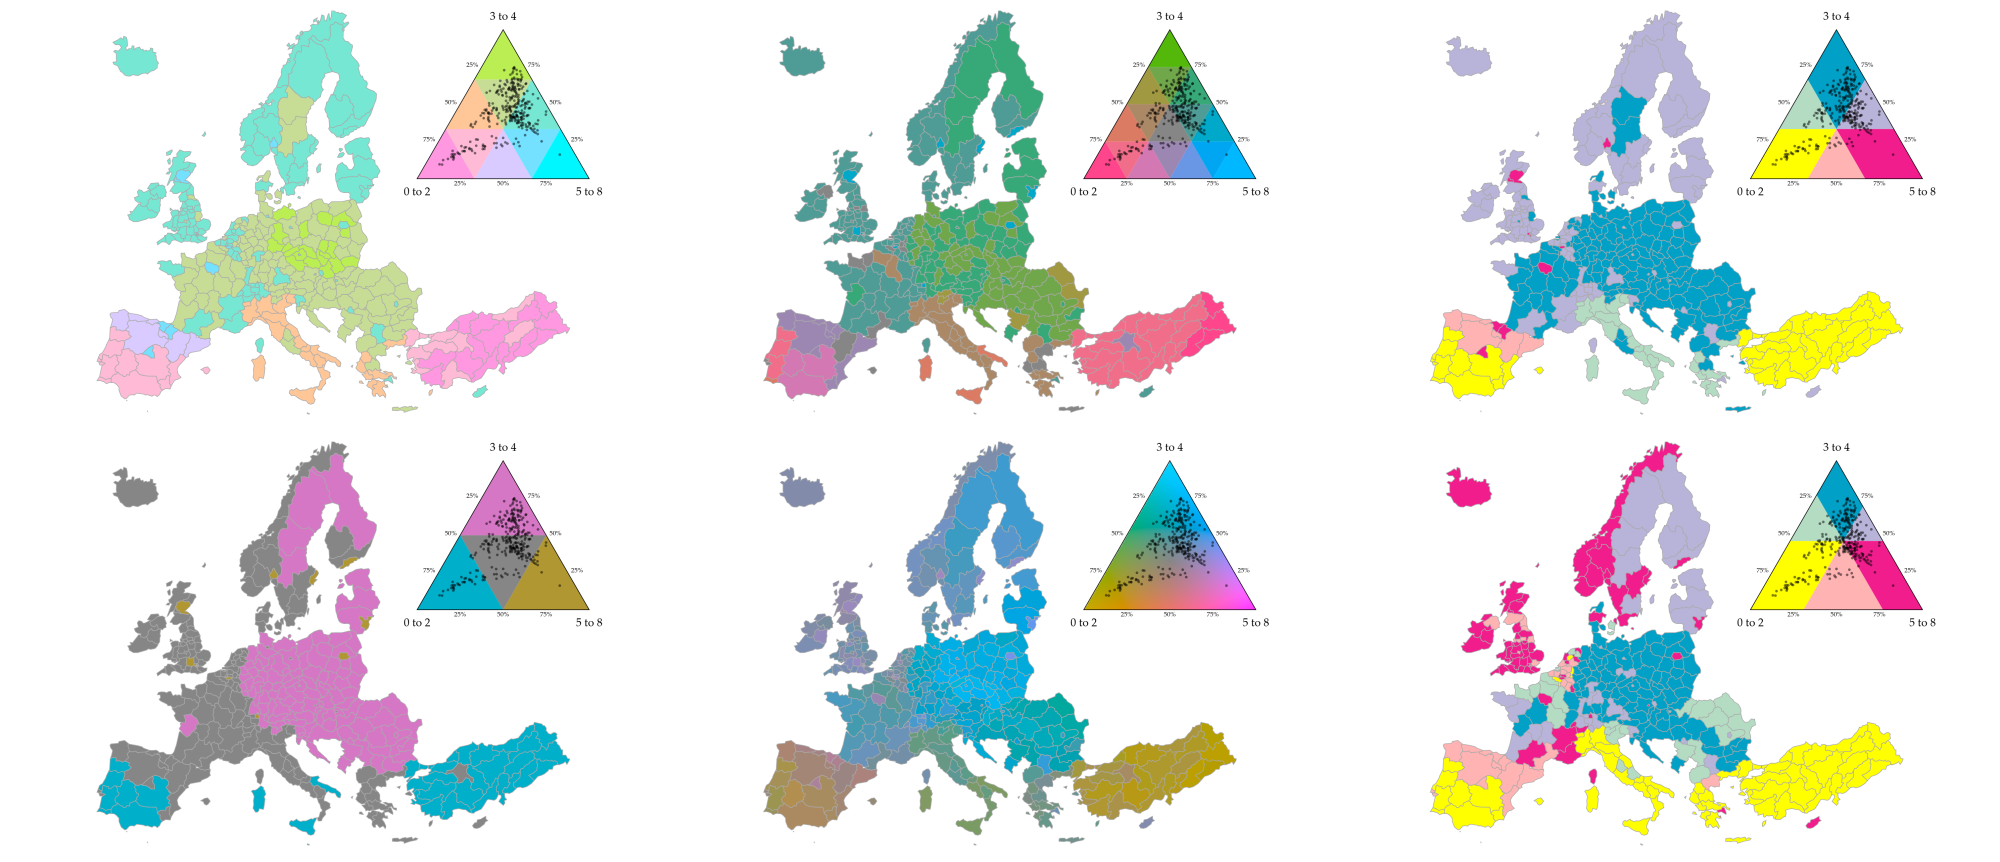
A JavaScript/TypeScript library for visualizing ternary compositions with choropleth maps, heavily inspired by the R tricolore package.
Example notebook
Example notebook (Sextant)
Installation
npm install tricolore # Replace npm by you package manager of choice (yarn, pnpm, ...)
If you plan to use the visualization components, you'll also need D3.js, either included in your HTML document or installed via npm/yarn:
npm install d3 # Replace npm by you package manager of choice (yarn, pnpm, ...)
Usage
Basic Color Mapping
import { tricolore } from 'tricolore';
// Create some ternary compositions (p1 + p2 + p3 = 1)
const data = [
[0.7, 0.2, 0.1],
[0.3, 0.6, 0.1],
[0.2, 0.3, 0.5]
];
// Get color codes for each composition
const colors = tricolore(data, {
center: [1/3, 1/3, 1/3], // Center of the color scale
breaks: 3, // Discretization level (use Infinity for continuous)
hue: 80, // Primary hue
chroma: 140, // Color intensity
lightness: 80, // Color lightness
contrast: 0.4, // Contrast between colors
spread: 1 // Spread of colors around center
});
console.log(colors); // An array of hex color codes
Color mapping (+ mean centering)
import { tricolore, CompositionUtils } from 'tricolore';
// Create some ternary compositions (p1 + p2 + p3 = 1)
const data = [
[0.7, 0.2, 0.1],
[0.3, 0.6, 0.1],
[0.2, 0.3, 0.5]
];
// Compute center
const center = CompositionUtils.center(data);
// Get color codes for each composition
const colors = tricolore(data, {
center: center, // Use the computed center
breaks: Infinity, // Discretization level (Infinity for continuous color scale)
hue: 10, // Primary hue
chroma: 120, // Color intensity
lightness: 70, // Color lightness
contrast: 0.2, // Contrast between colors
spread: 1 // Spread of colors around center
});
console.log(colors); // An array of hex color codes
Visualization with D3.js
import { TricoloreViz } from 'tricolore';
// You can pass a DOM selector or an HTML element or a d3 selection
// as the first argument
// The second and third arguments are width and height of the SVG container
// where the plot will be rendered
const viz = new TricoloreViz('#container', 500, 500);
// Create a continuous ternary plot
viz.createContinuousPlot(data, {
hue: 80,
chroma: 140,
lightness: 80,
contrast: 0.4,
spread: 1,
// Whether to show the data points on top of the color scale
showData: true,
// Whether to show the center point
showCenter: true,
// Labels for the three corners
labels: ['Factor 1', 'Factor 2', 'Factor 3'],
// Position of the labels: 'corner' (default), 'edge'
labelPosition: 'corner',
});
// Create a discrete ternary plot
viz.createDiscretePlot(data, {
hue: 80,
chroma: 140,
lightness: 80,
contrast: 0.4,
spread: 1,
breaks: 3,
showData: true,
labelPosition: 'edge',
});
// Create a sextant ternary plot
viz.createSextantPlot(data, {
values: ['#FFFF00', '#B3DCC3', '#01A0C6', '#B8B3D8', '#F11D8C', '#FFB3B3'],
showData: true,
labelPosition: 'edge',
});
Choropleth Maps
import { tricolore } from 'tricolore';
import * as d3 from 'd3';
// Assuming you have GeoJSON with ternary data
d3.json('regions.json').then((geojson) => {
// Extract compositions from properties
const data = geojson.features.map((f) =>
[f.properties.var1, f.properties.var2, f.properties.var3]
);
// Get colors
const colors = tricolore(data);
// Create map
const svg = d3.select('#map')
.append('svg')
.attr('width', 800)
.attr('height', 500);
const projection = d3.geoMercator().fitSize([800, 500], geojson);
const path = d3.geoPath().projection(projection);
svg.selectAll('path')
.data(geojson.features)
.enter()
.append('path')
.attr('d', path)
.attr('fill', (d, i) => colors[i]); // Use the computed colors
});
API Documentation
See the full documentation for detailed API reference.
License
GPL-3.0 License. See the LICENSE file for details.