Plot a scale bar.
barscale(
  size,
  lwd = 1.5,
  cex = 0.6,
  pos = "bottomright",
  style = "pretty",
  unit = "km"
)
Arguments
- size
size of the scale bar in units (default to km). If size is not set, an automatic size is used (1/10 of the map width).
- lwd
width of the scale bar.
- cex
cex of the text.
- pos
position of the legend, default to "bottomright". "bottomright" or a vector of two coordinates (c(x, y)) are possible.
- style
style of the legend, either "pretty" or "oldschool". The "oldschool" style only uses the "size" parameter.
- unit
units used for the scale bar. Can be "mi" for miles, "m" for meters, or "km" for kilometers (default)
Note
This scale bar is not accurate on unprojected (long/lat) maps.
See also
Examples
library(sf)
#> Linking to GEOS 3.9.0, GDAL 3.2.2, PROJ 7.2.1; sf_use_s2() is TRUE
mtq <- st_read(system.file("gpkg/mtq.gpkg", package="cartography"))
#> Reading layer `mtq' from data source
#> `/tmp/RtmpmpfIrO/temp_libpath18ee15f22a9e/cartography/gpkg/mtq.gpkg'
#> using driver `GPKG'
#> Simple feature collection with 34 features and 7 fields
#> Geometry type: MULTIPOLYGON
#> Dimension: XY
#> Bounding box: xmin: 690574 ymin: 1592536 xmax: 735940.2 ymax: 1645660
#> Projected CRS: WGS 84 / UTM zone 20N
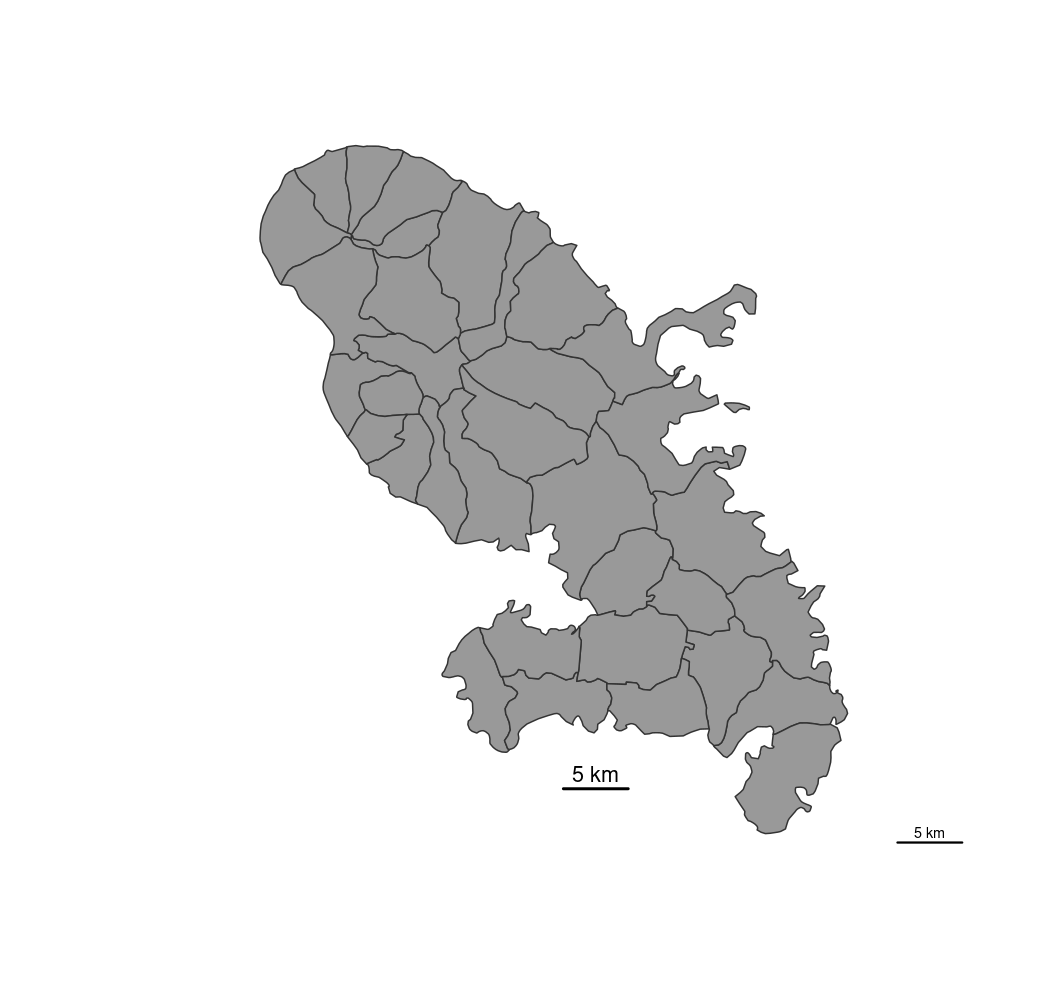
plot(st_geometry(mtq), col = "grey60", border = "grey20")
barscale(size = 5)
barscale(size = 5, lwd = 2, cex = .9, pos = c(714000, 1596000))