Plot a waffle layer.
waffleLayer(
  x,
  var,
  cellvalue,
  cellsize,
  cellrnd = "ceiling",
  celltxt = paste0("1 cell = ", cellvalue),
  labels,
  ncols,
  col,
  border = "white",
  lwd = 0.2,
  legend.pos = "bottomleft",
  legend.title.txt = "legend title",
  legend.title.cex = 0.8,
  legend.values.cex = 0.6,
  legend.frame = FALSE,
  add = TRUE
)
Arguments
- x
an sf object, a simple feature collection.
- var
names of the numeric variable to plot.
- cellvalue
value of a single cell. Original values are rounded, using
cellrndmethod, to be expressed as multiple ofcellvalue.- cellsize
size of single cell, in map units.
- cellrnd
rounding method, one of "ceiling", "floor", "round".
- celltxt
text that appears under the legend.
- labels
names that will appear in the legend.
- ncols
number of columns of the waffles
- col
a vector of colors.
- border
color of the cells borders.
- lwd
cells borders width.
- legend.pos
position of the legend, one of "topleft", "top", "topright", "right", "bottomright", "bottom", "bottomleft", "left" or a vector of two coordinates in map units (c(x, y)). If legend.pos is "n" then the legend is not plotted.
- legend.title.txt
title of the legend.
- legend.title.cex
size of the legend title.
- legend.values.cex
size of the values in the legend.
- legend.frame
whether to add a frame to the legend (TRUE) or not (FALSE).
- add
whether to add the layer to an existing plot (TRUE) or not (FALSE).
Examples
library(sf)
mtq <- st_read(system.file("gpkg/mtq.gpkg", package = "cartography"),
quiet = TRUE)
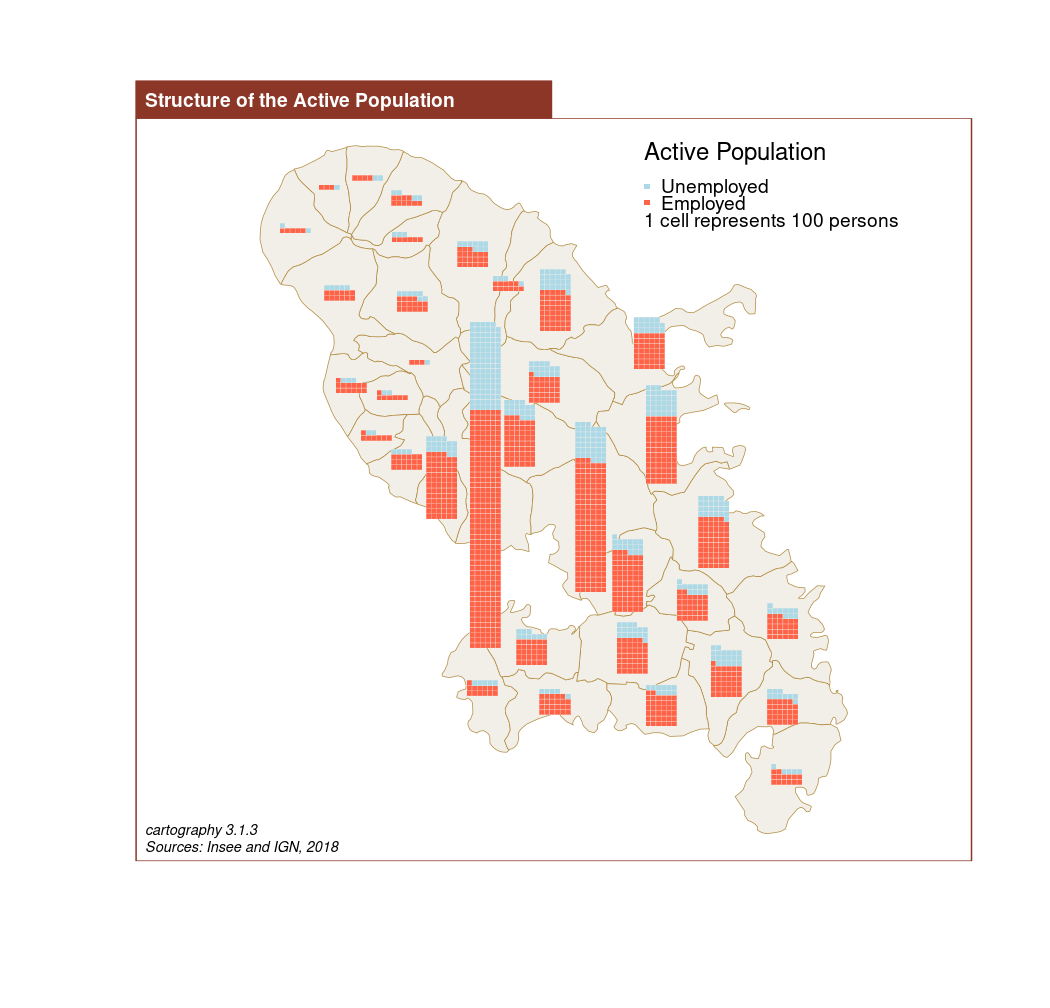
# number of employed persons
mtq$EMP <- mtq$ACT - mtq$CHOM
plot(st_geometry(mtq),
col = "#f2efe9",
border = "#b38e43",
lwd = 0.5)
waffleLayer(
x = mtq,
var = c("EMP", "CHOM"),
cellvalue = 100,
cellsize = 400,
cellrnd = "ceiling",
celltxt = "1 cell represents 100 persons",
labels = c("Employed", "Unemployed"),
ncols = 6,
col = c("tomato1", "lightblue"),
border = "#f2efe9",
legend.pos = "topright",
legend.title.cex = 1,
legend.title.txt = "Active Population",
legend.values.cex = 0.8,
add = TRUE
)
layoutLayer(
title = "Structure of the Active Population",
col = "tomato4",
tabtitle = TRUE,
scale = FALSE,
sources = paste0("cartography ", packageVersion("cartography")),
author = "Sources: Insee and IGN, 2018",
)