With the typo map type, mf_map() displays a typology map.
In typology maps, areas are shaded according to the modalities of a qualitative variable.
Usage
For polygons:
mf_map(x, var, type = "typo",
       pal, rev = FALSE, val_order,
       border, lwd = 0.7, col_na = "white",
       alpha, expandBB, extent, bg, add = FALSE, leg_*)
For points:
mf_map(x, var, type = "typo",
       pal, rev = FALSE, val_order,
       border, pch = 21, cex = 2, lwd = 0.7, col_na = "white",
       alpha, expandBB, extent, bg, add = FALSE, leg_*)
For lines:
mf_map(x, var, type = "typo",
       pal, rev = FALSE, val_order, lwd = .7,
       col_na = "white",
       alpha, expandBB, extent, bg, add = FALSE, leg_*)
Arguments
- x
object of class
sf- var
name of the variable to map
- type
"choro"
- pal
a set of colors (hex codes) or a palette name. Palette names can be obtained with hcl.pals. The default palette is the pal_quali palette (see mf_theme).
- rev
if
palis a palette name, whether the ordering of the colors should be reversed (TRUE) or not (FALSE)- val_order
modalities order in the legend, a character vector that matches
varmodalities. Default to alphabetic order of modalities.- border
border color for polygons and symbols, a hex code or color name given by colors. The default color for polygons is the highlight color, the default color for points is the background color (see mf_theme).
- lwd
border width for polygons and points symbols, lines width
- pch
type of symbol to use for points, see pch (points only)
- cex
symbols size, 2 means 2 times bigger (points only)
- col_na
color for missing values, a hex code or a color name given by colors.
- alpha, expandBB, extent, bg, add
arguments described in mf_map
- leg_*
legend arguments described in mf_map
Examples
mtq <- mf_get_mtq()
pts <- mf_get_mtq("points")
flows <- mf_get_mtq("lines")
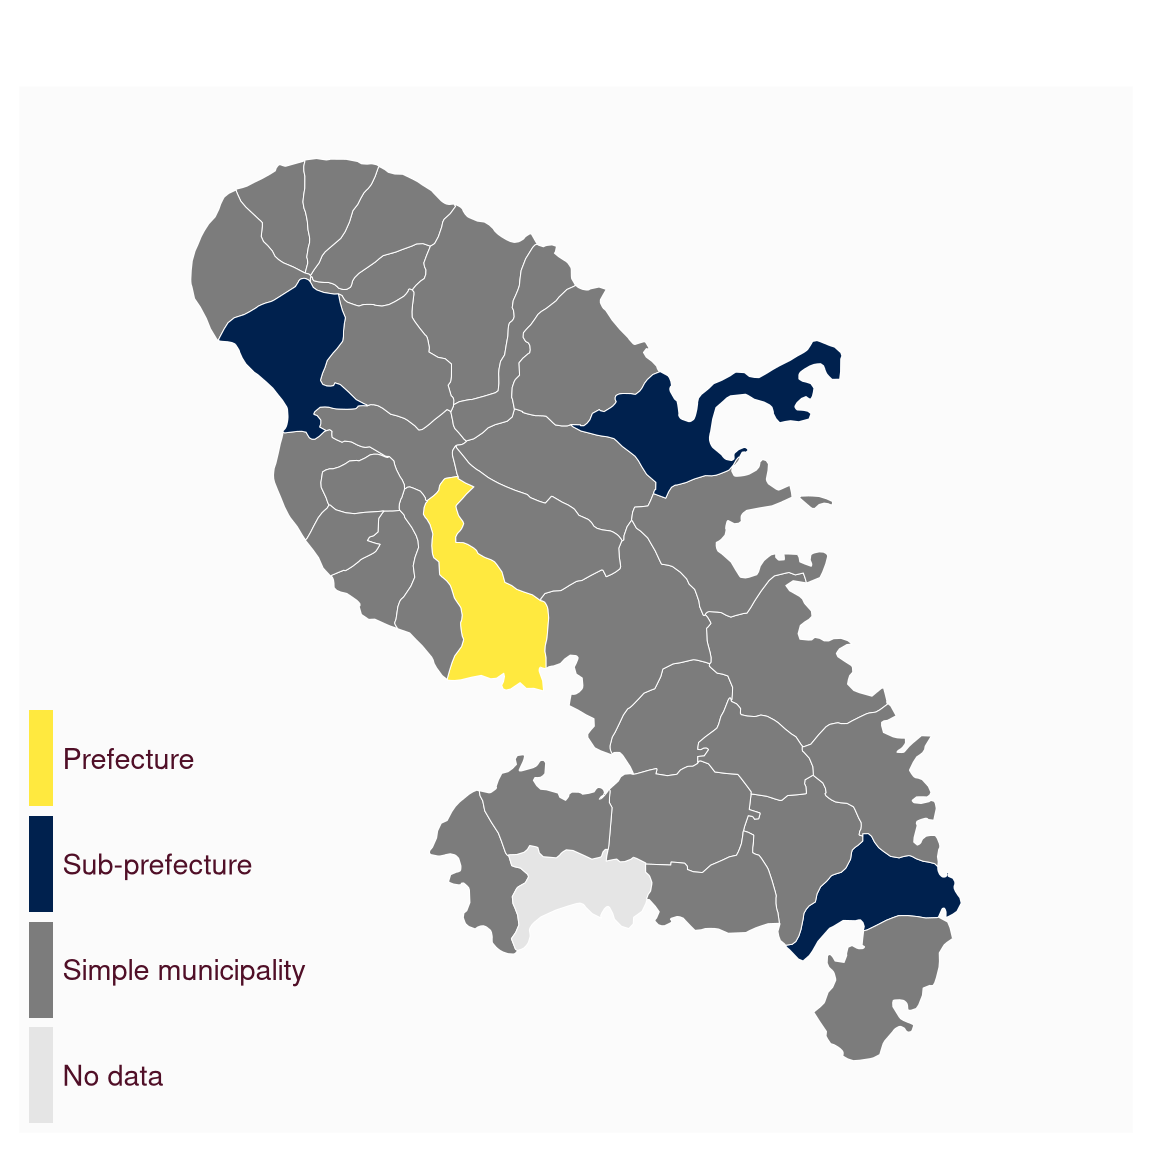
# polygons
mtq[6, "STATUS"] <- NA
mf_map(
x = mtq, var = "STATUS", type = "typo",
col_na = "grey90", border = "white",
pal = c("#FFE93F", "#00214E", "#7C7C7C"),
val_order = c("Prefecture", "Sub-prefecture", "Simple municipality"),
lwd = .5, leg_pos = "bottomleft",
leg_title = "", leg_title_cex = 1,
leg_val_cex = .9, leg_no_data = "No data",
leg_box_cex = c(0.5, 3), leg_box_border = NA
)
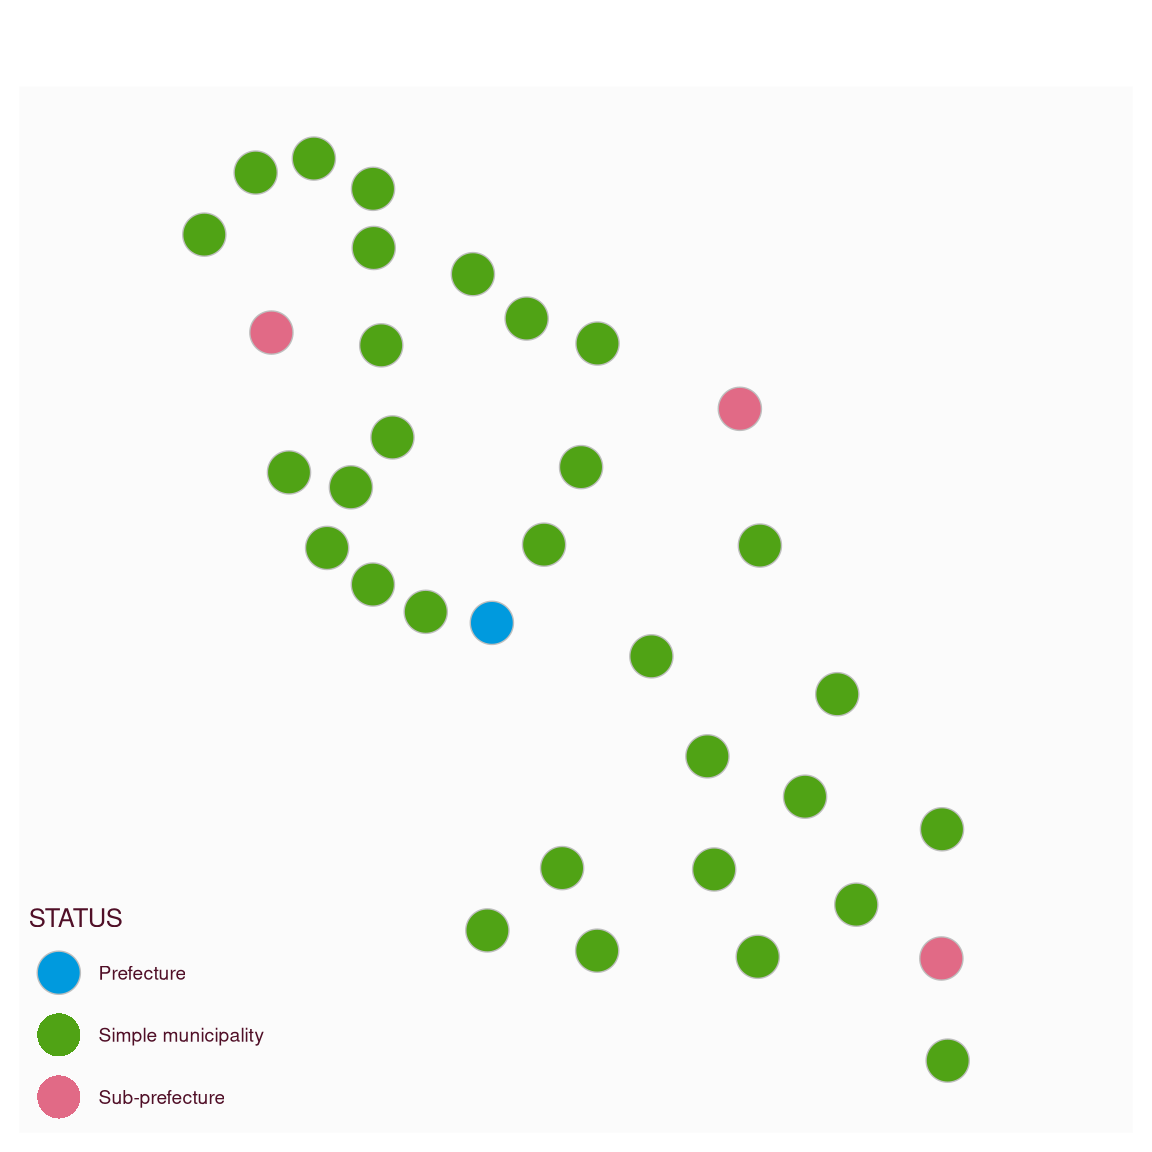
 # points
mf_map(
x = pts, var = "STATUS", type = "typo",
cex = 3, pal = "Dark 3", border = "grey",
leg_pos = "bottomleft"
)
# points
mf_map(
x = pts, var = "STATUS", type = "typo",
cex = 3, pal = "Dark 3", border = "grey",
leg_pos = "bottomleft"
)
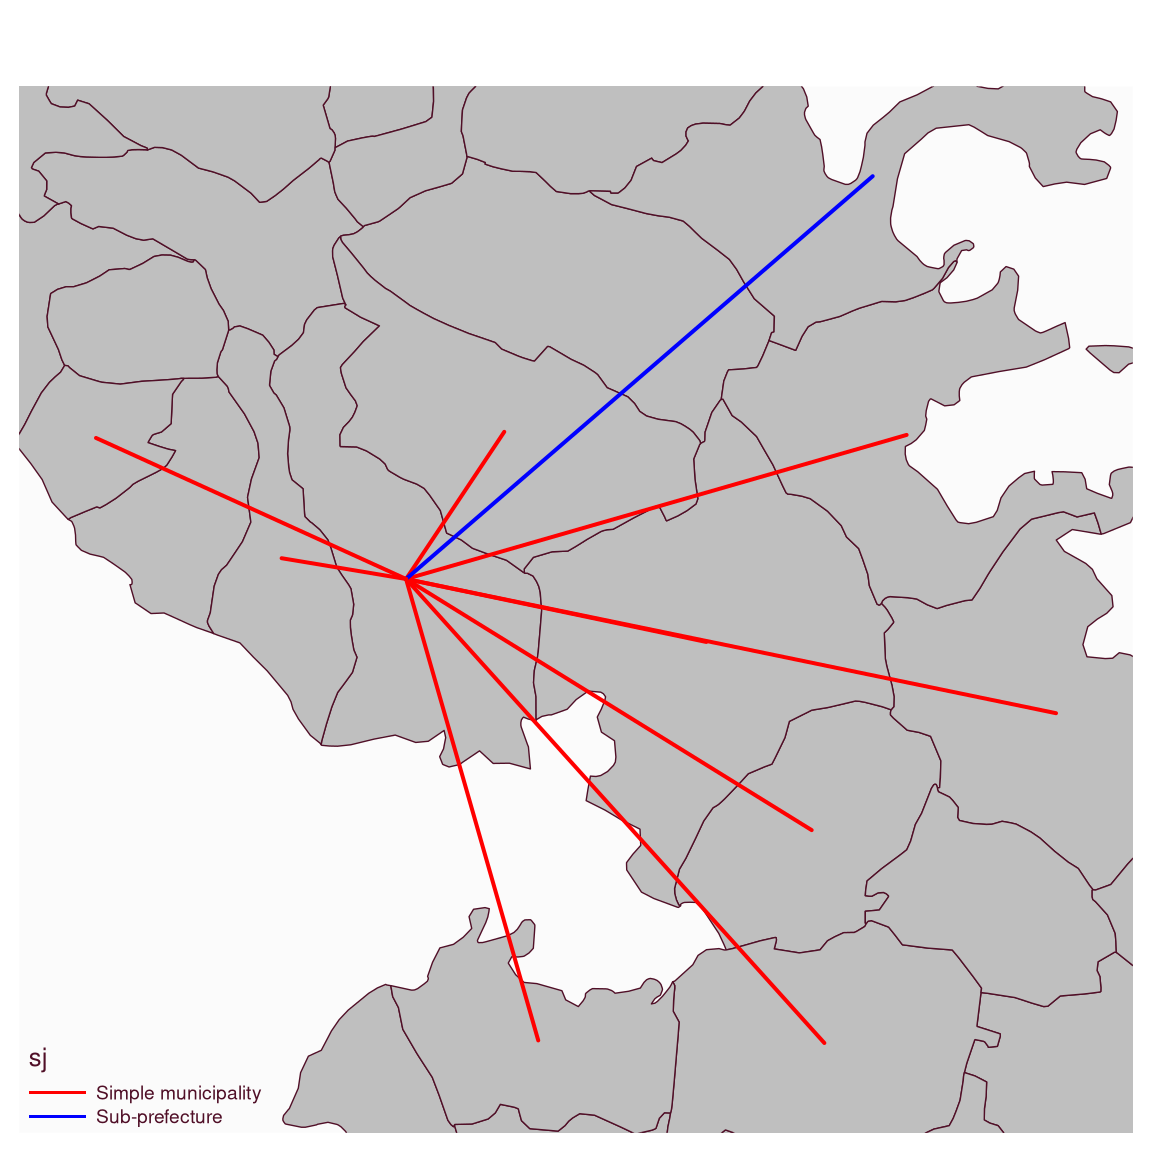
 # lines
mf_map(mtq, extent = flows)
mf_map(
x = flows, var = "sj", type = "typo",
add = TRUE,
lwd = 2, pal = c("red", "blue"),
leg_pos = "bottomleft"
)
# lines
mf_map(mtq, extent = flows)
mf_map(
x = flows, var = "sj", type = "typo",
add = TRUE,
lwd = 2, pal = c("red", "blue"),
leg_pos = "bottomleft"
)