With the choro map type, mf_map() displays a choropleth map.
In choropleth maps, areas are shaded according to the variation of a quantitative variable. They are used to represent ratios or indices.
Usage
For polygons:
mf_map(x, var, type = "choro",
       breaks = "quantile", nbreaks, pal, rev = FALSE,
       border, lwd = 0.7, col_na = "white",
       alpha, expandBB, extent, bg, add = FALSE, leg_*)
For points:
mf_map(x, var, type = "choro",
       breaks = "quantile", nbreaks, pal, rev = FALSE,
       border, pch = 21, cex = 2, lwd = 0.7, col_na = "white",
       alpha, expandBB, extent, bg, add = FALSE, leg_*)
For lines:
mf_map(x, var, type = "choro",
       breaks = "quantile", nbreaks, pal, rev = FALSE, lwd = .7,
       col_na = "white",
       alpha, expandBB, extent, bg, add = FALSE, leg_*)
Arguments
- x
object of class
sf- var
name of the variable to map
- type
"choro"
- breaks
either a numeric vector with the actual breaks, or a classification method name. The main methods are 'quantile', 'equal', 'msd', 'ckmeans' (natural breaks), 'Q6' and 'geom'. See mf_get_breaks for details.
- nbreaks
number of classes
- pal
a set of colors (hex codes) or a palette name. Palette names can be obtained with hcl.pals. The default palette is the pal_seq palette (see mf_theme).
- rev
if
palis a palette name, whether the ordering of the colors should be reversed (TRUE) or not (FALSE)- border
border color for polygons and symbols, a hex code or color name given by colors. The default color for polygons is the highlight color, the default color for points is the background color (see mf_theme).
- lwd
border width for polygons and points symbols, lines width
- pch
type of symbol to use for points, see pch (points only)
- cex
symbols size, 2 means 2 times bigger (points only)
- col_na
color for missing values, a hex code or a color name given by colors.
- alpha, expandBB, extent, bg, add
arguments described in mf_map
- leg_*
legend arguments described in mf_map
Examples
mtq <- mf_get_mtq()
pts <- mf_get_mtq("points")
flows <- mf_get_mtq("lines")
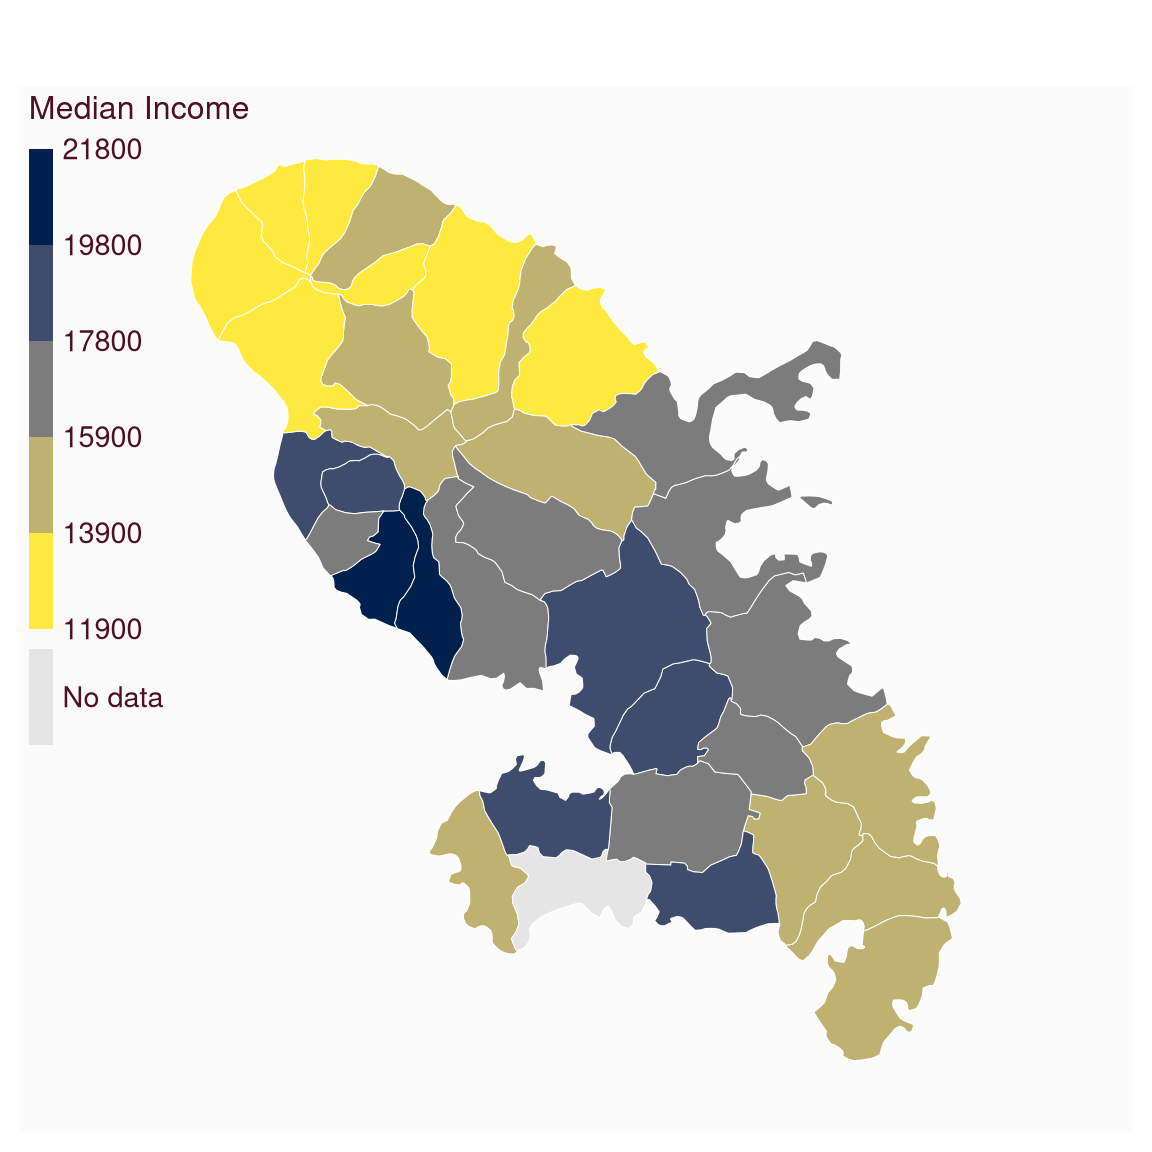
# polygons
mtq[6, "MED"] <- NA
mf_map(
x = mtq, var = "MED", type = "choro",
col_na = "grey90", pal = "Cividis",
breaks = "equal", nbreaks = 5, border = "white",
lwd = .5, leg_pos = "topleft",
leg_title = "Median Income", leg_title_cex = 1,
leg_val_cex = .9, leg_val_rnd = -2, leg_no_data = "No data",
leg_box_cex = c(0.5, 3), leg_box_border = NA, leg_frame = FALSE
)
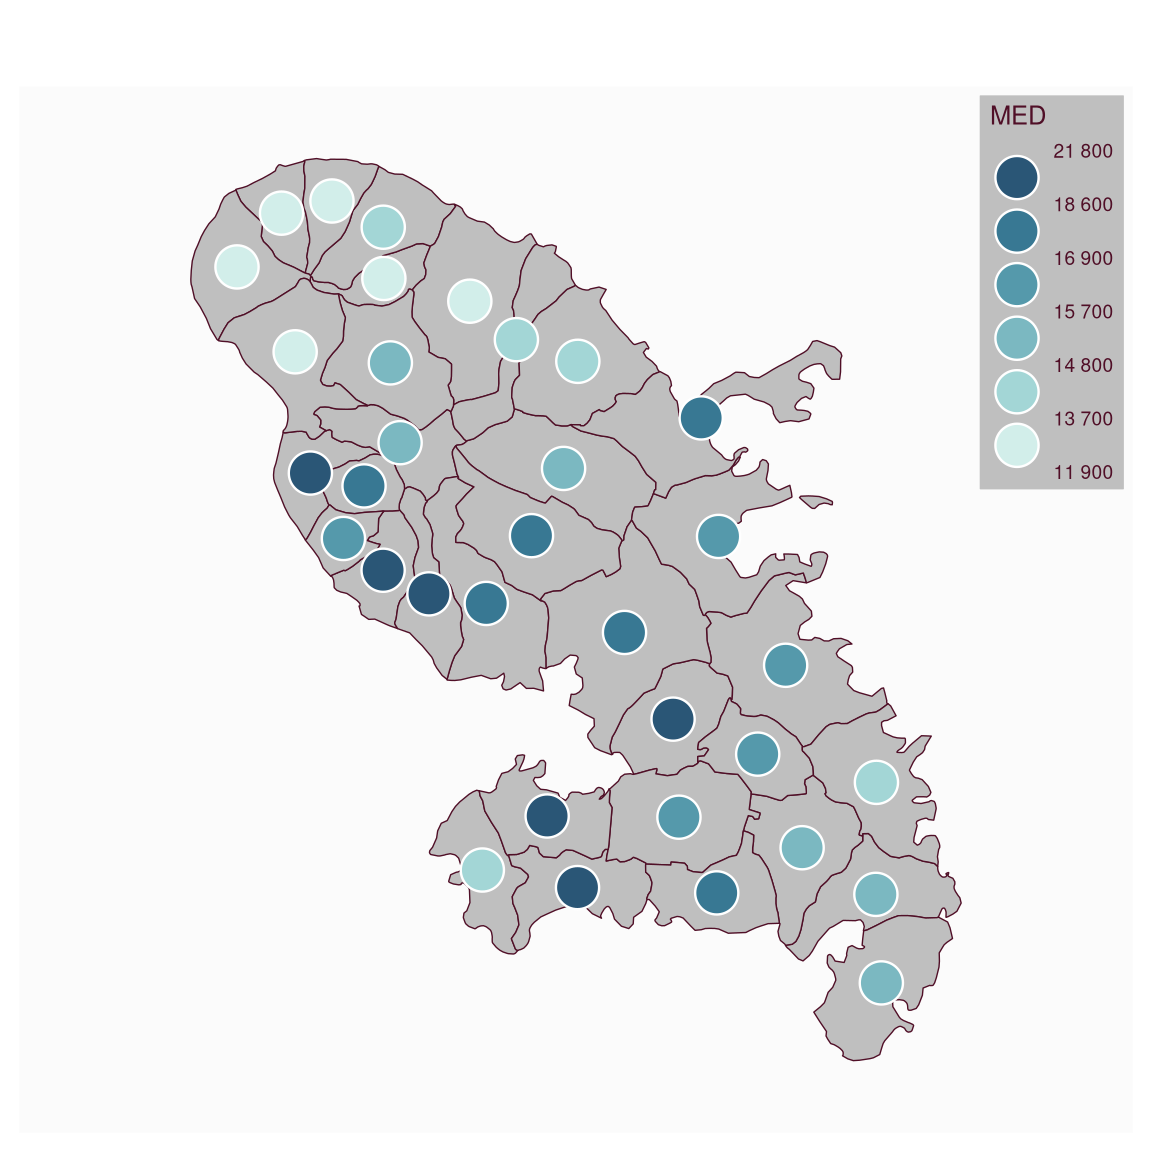
 # points
mf_map(mtq)
mf_map(
x = pts, var = "MED", type = "choro",
pch = 21, cex = 3, lwd = 1.2,
pal = "Teal", border = "white",
leg_horiz = FALSE, leg_val_big = " ",
leg_val_rnd = -2, leg_pos = "topright",
leg_frame = TRUE, add = TRUE
)
# points
mf_map(mtq)
mf_map(
x = pts, var = "MED", type = "choro",
pch = 21, cex = 3, lwd = 1.2,
pal = "Teal", border = "white",
leg_horiz = FALSE, leg_val_big = " ",
leg_val_rnd = -2, leg_pos = "topright",
leg_frame = TRUE, add = TRUE
)
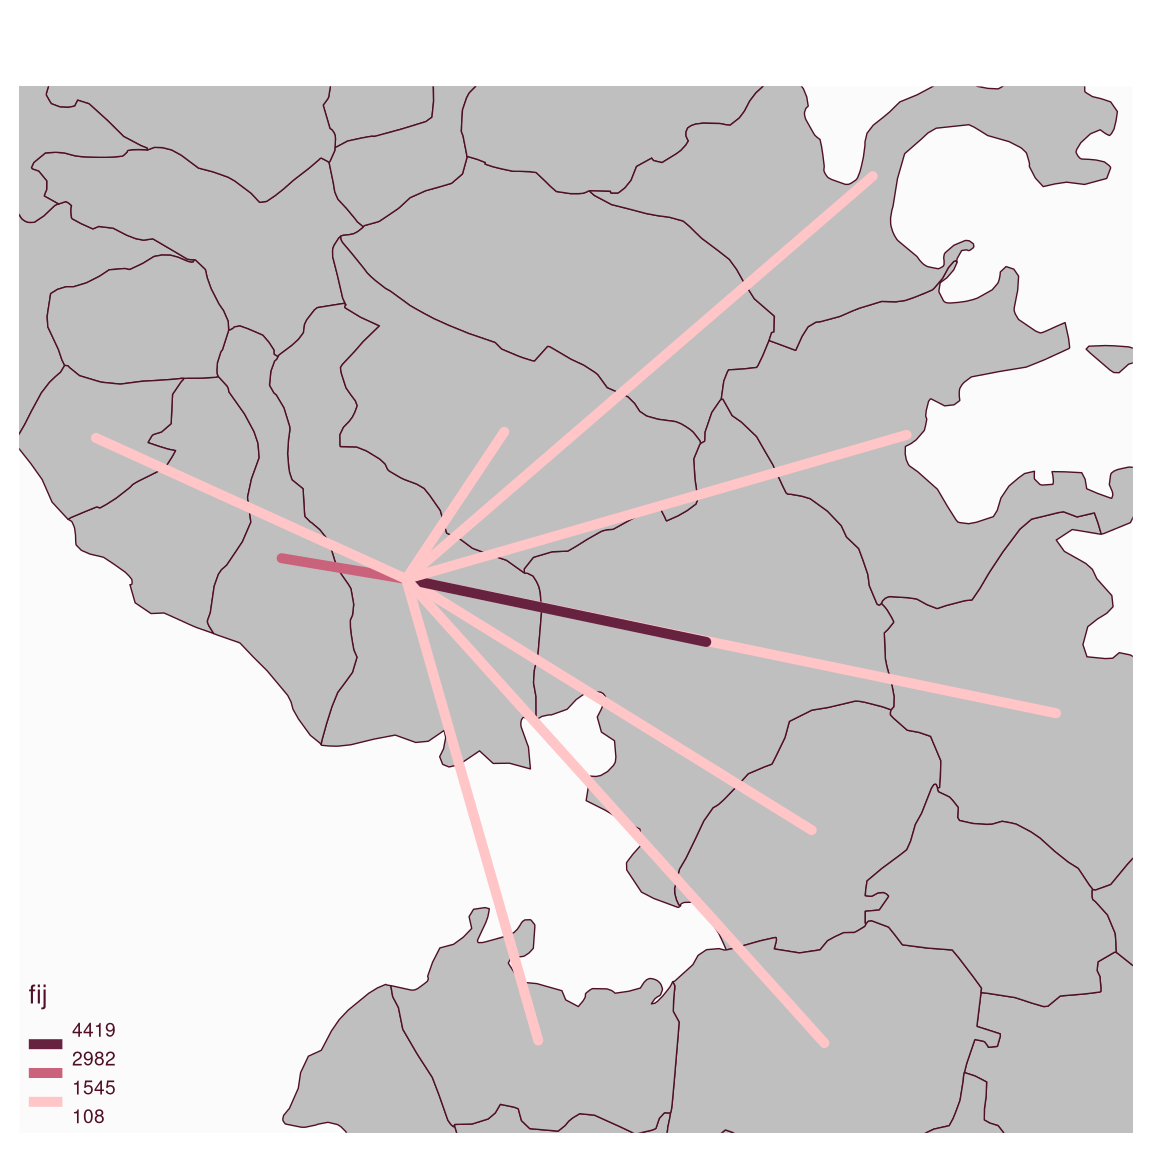
 # lines
mf_map(mtq, extent = flows)
mf_map(
x = flows, var = "fij", type = "choro",
breaks = "equal", nbreaks = 3, add = TRUE,
lwd = 5, pal = "Burg", leg_horiz = TRUE,
leg_box_cex = c(.7, 1),
leg_val_rnd = 0, leg_pos = "bottomleft"
)
# lines
mf_map(mtq, extent = flows)
mf_map(
x = flows, var = "fij", type = "choro",
breaks = "equal", nbreaks = 3, add = TRUE,
lwd = 5, pal = "Burg", leg_horiz = TRUE,
leg_box_cex = c(.7, 1),
leg_val_rnd = 0, leg_pos = "bottomleft"
)