mf_map() with prop_typo type creates symbols that are proportional
to values of a first variable and colored to reflect the modalities of a
second qualitative variable.
This map types uses two variables and some arguments need to be set for both variables (see Details).
For polygons, centroids are used to plot proportional symbols.
Usage
For polygons and points:
mf_map(x, var, type = "prop_typo",
       inches = 0.3, val_max, symbol, border,
       pal, rev = FALSE, val_order,
       border, lwd = 0.7, col_na = "white",
       alpha, expandBB, extent, bg, add = FALSE, leg_*)
For lines:
mf_map(x, var, type = "typo",
       lwd_max = 15,
       pal, rev = FALSE, val_order,
       col_na = "white",
       alpha, expandBB, extent, bg, add = FALSE, leg_*)
Arguments
- x
object of class
sf- var
names of the variables to map. The first value refers to the proportional symbols, the second one to the typology coloration.
- type
"prop_typo"
- inches
size of the largest symbol in inches (radius for circles, half width for squares)
- lwd_max
width of the largest line
- val_max
maximum value corresponding to the largest symbol or line
- symbol
type of proportional symbols, either "circle" or "square"
- border
border color for proportional symbols, a hex code or color name given by colors. The default color is the background color (see mf_theme).
- pal
a set of colors (hex codes) or a palette name. Palette names can be obtained with hcl.pals. The default palette is the pal_quali palette (see mf_theme).
- rev
if
palis a palette name, whether the ordering of the colors should be reversed (TRUE) or not (FALSE)- val_order
modalities order in the legend, a character vector that matches
varmodalities. Default to alphabetic order of modalities.- col_na
color for missing values, a hex code or a color name given by colors.
- alpha, expandBB, extent, bg, add
arguments described in mf_map
- leg_*
legend arguments described in mf_map. See details for arguments with two values.
Details
'leg_title' needs two values. The first value refers to the symbols legend, the second one to the choropleth legend.
Examples
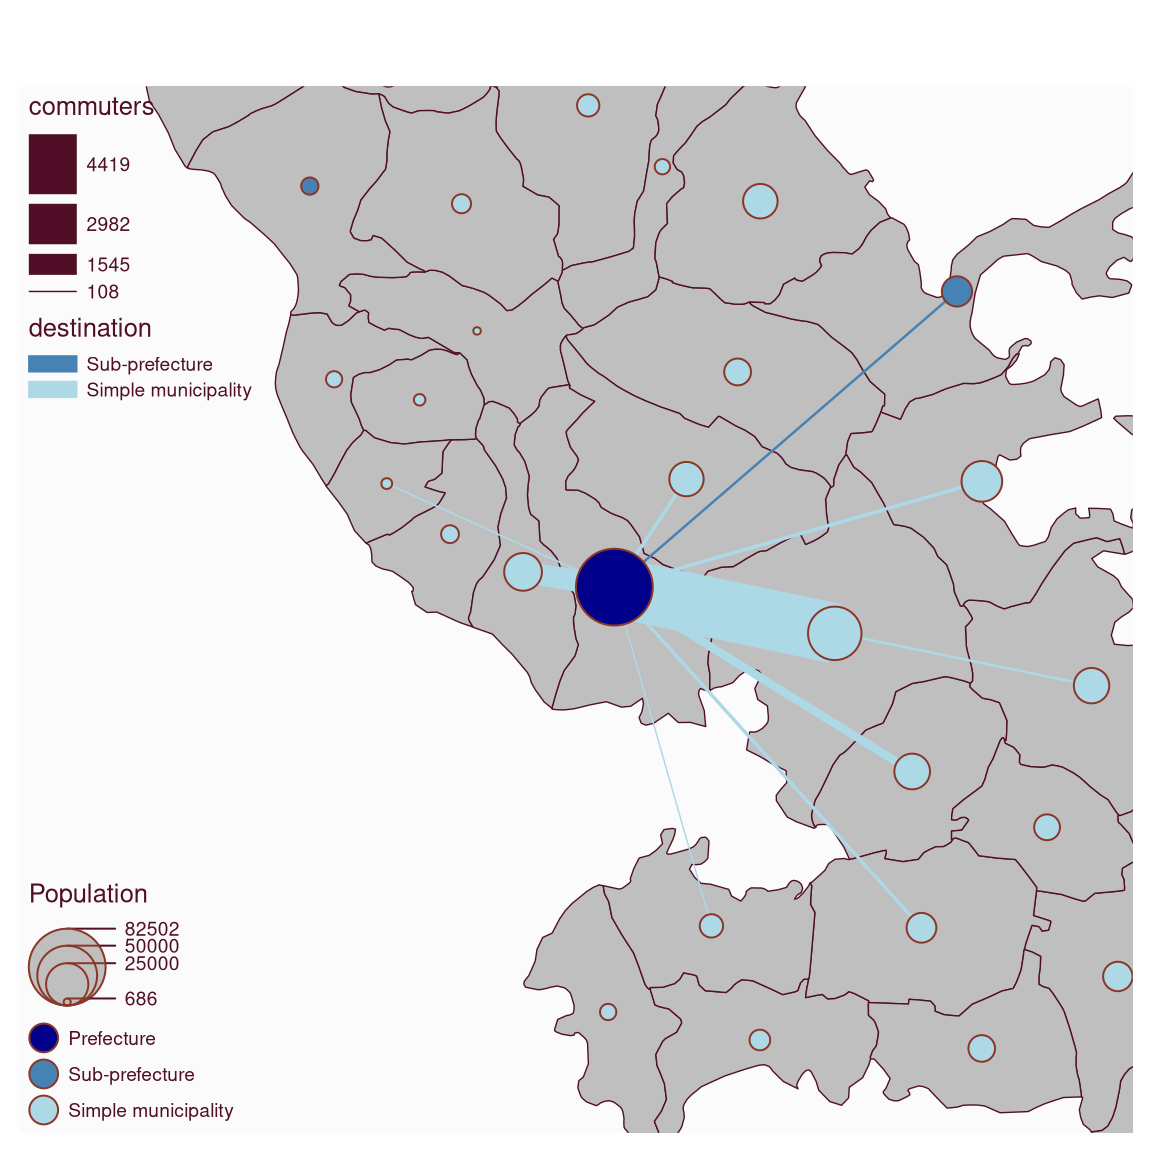
mtq <- mf_get_mtq()
flows <- mf_get_mtq("lines")
mf_map(mtq, extent = flows, expandBB = c(0, .5, 0, 0))
mf_map(flows, c("fij", "sj"), "prop_typo",
  val_order = c("Sub-prefecture", "Simple municipality"),
  pal = c("steelblue", "lightblue"), lwd_max = 30,
  leg_pos = "topleft", leg_title = c("commuters", "destination")
)
mf_map(
  x = mtq, var = c("POP", "STATUS"), type = "prop_typo",
  inches = .2, border = "tomato4", lwd = 1,
  pal = c("darkblue", "steelblue", "lightblue"),
  val_order = c("Prefecture", "Sub-prefecture", "Simple municipality"),
  leg_pos = "bottomleft",
  leg_title = c("Population", ""),
  leg_no_data = "No dada",
  add = TRUE
)